My MicroK8s Cluster Is Now Manged by Azure. What is next? - Part II - Monitoring
Using Azure Arc-enabled Kubernetes to Monitor, Secure, Regulate, Deploy and more
This is next blog in a series of blogs I just started that share my experiences with integrating Azure services with my on-premises deployment of MicroK8s Kubernetes cluster running in WSL. These blog series are an extension of another blog series I did called MicroK8S and WSL Managed by Azure Arc.
At a high level there is a lot of Azure Services we can integrate and use with our Kubernetes clusters running anywhere, such as on-premises, or even GCP and AWS. As long as we can manage them using Azure Arc there is a good number of Azure tools and services we now have access to. Here is a short list of things I will try to blog about here:
- Deploying Configurations using GitOps
- Azure Resource Graph Queries
- Identity and Access Management
- Installing Cluster Extensions
- Monitor our Cluster using Azure Monitor Container Insights (Prometheus, and Grafana)
- Access Secrets from an Azure Key Vault
- Policy Enforcements using Azure Policy
- Threat Protection using Microsoft Defender for Cloud
- Deploy Azure Arc-enabled Open Service Mesh
- Azure Machine Learning for Kubernetes
- Event Grid on Kubernetes
- Azure Arc-enabled Data Services
These are some but not all of the things I would love to dig in and blog about here. It may be multiple blogs. I do want to cover Monitoring our cluster using Azure Monitor Container Insights, Azure Policy, and Microsoft Defender for Cloud for sure in this series. Some of the solutions I would not be able to deploy on my little single node cluster running on WSL. So I may end up blogging about those services with MicroK8s running on a VM running within Azure Stack HCI or something fun.
So join me on this next adventure.
Azure Monitor Container Insights with some mention about Prometheus and Managed Grafana.
So, lets begin this journey. Now a lot of the things I will do with my small MicroK8s cluster we can do with larger clusters running anywhere at this point. Since it is now an Azure Arc-enabled Kubernetes cluster the only thing that will be limiting for me is my WSL resources running on my Windows 10 laptop.
For more in-depth information about monitoring a Kubernetes cluster using Container Insights you can read the Microsoft Learn Documentation, Container Insights Overview. This blog may not dive deep enough into everything that can be done so please go back and read their documentation.
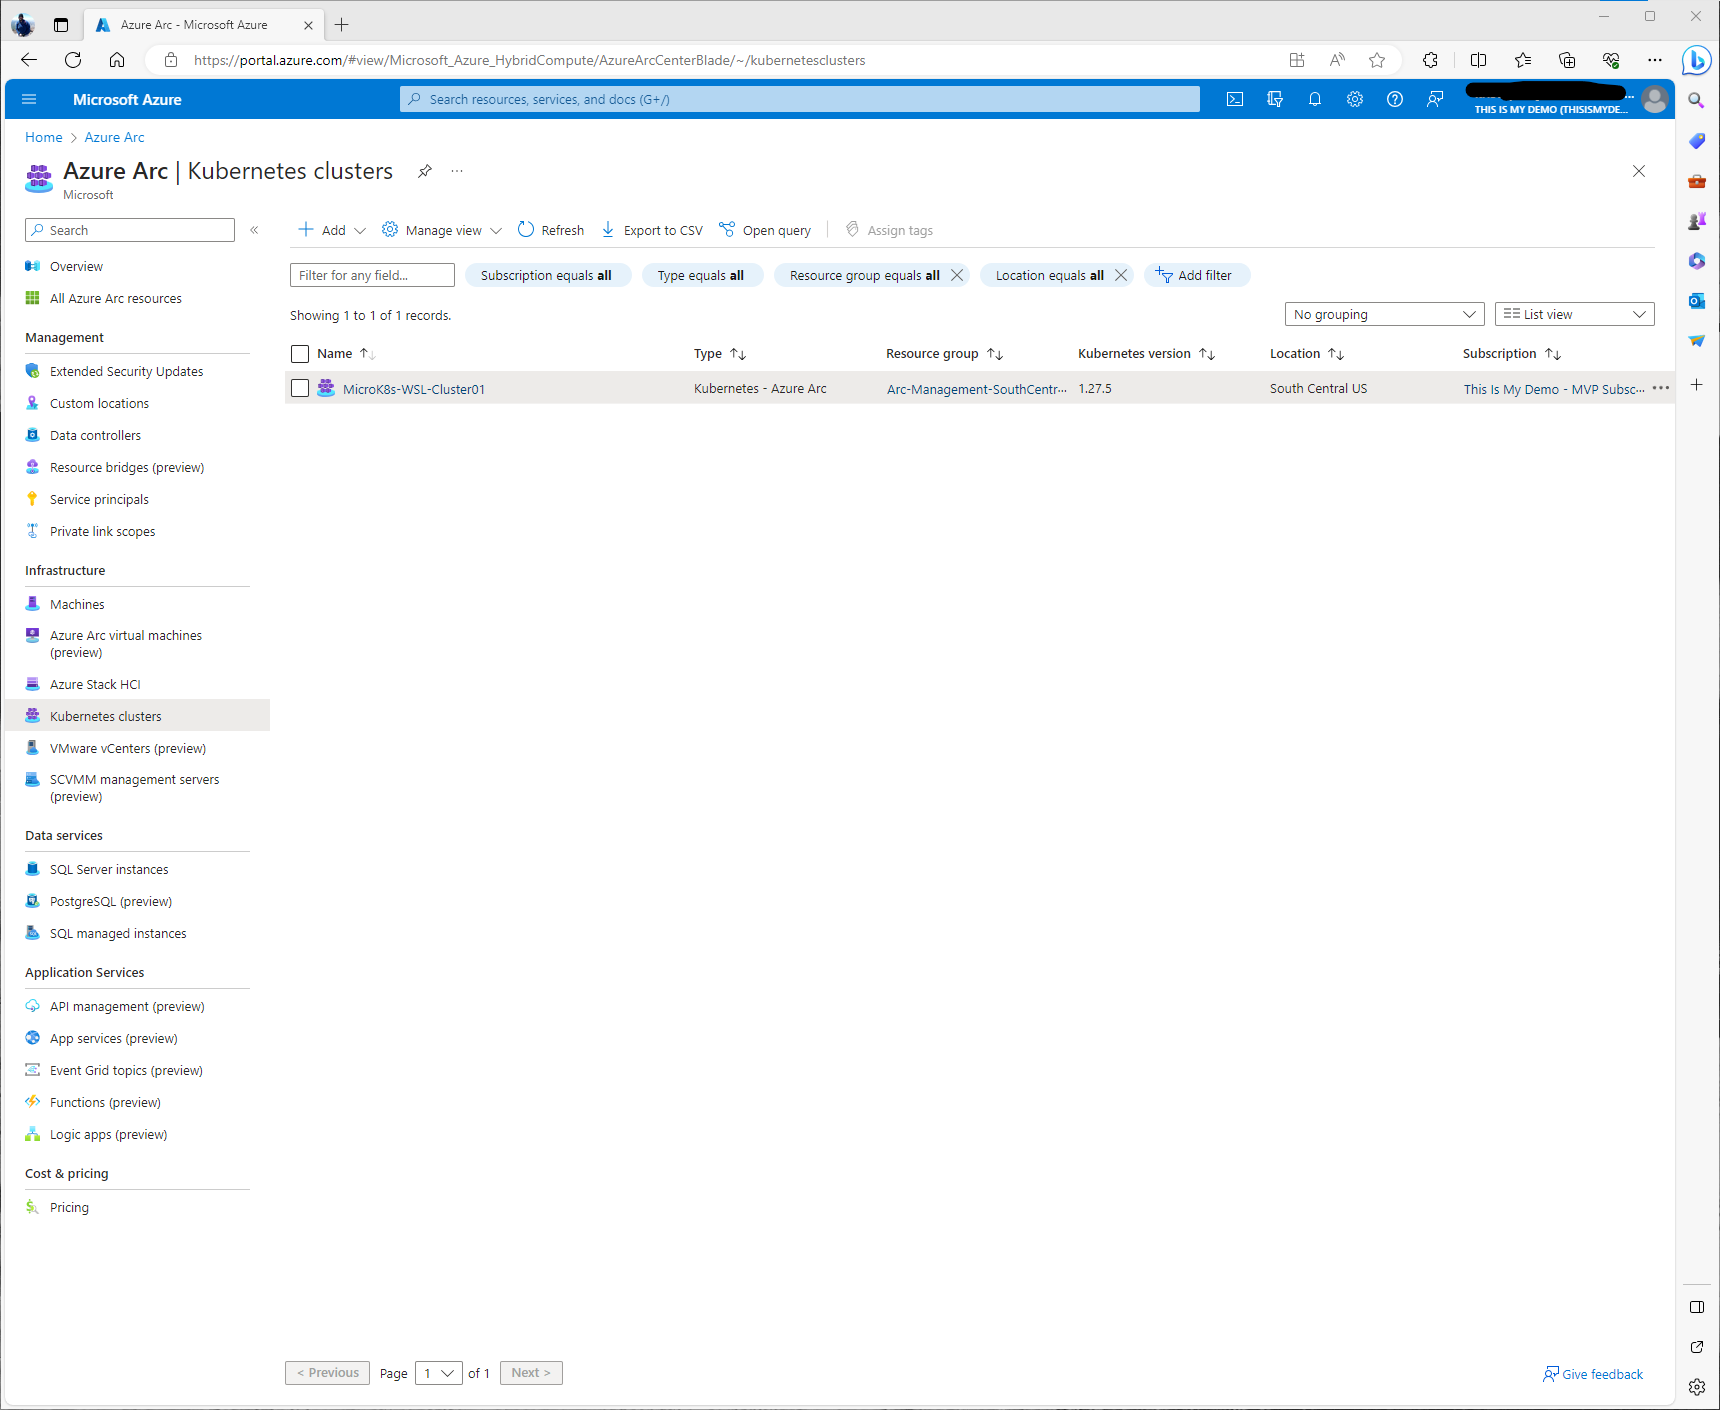
So first I am going to verify that my Kubernetes cluster is still connected by going to the Arc Blade in the Azure portal, then clicking on the Kubernetes section under Infrastructure. Here I can see my MicroK8s-WSL-Cluster01 resource.
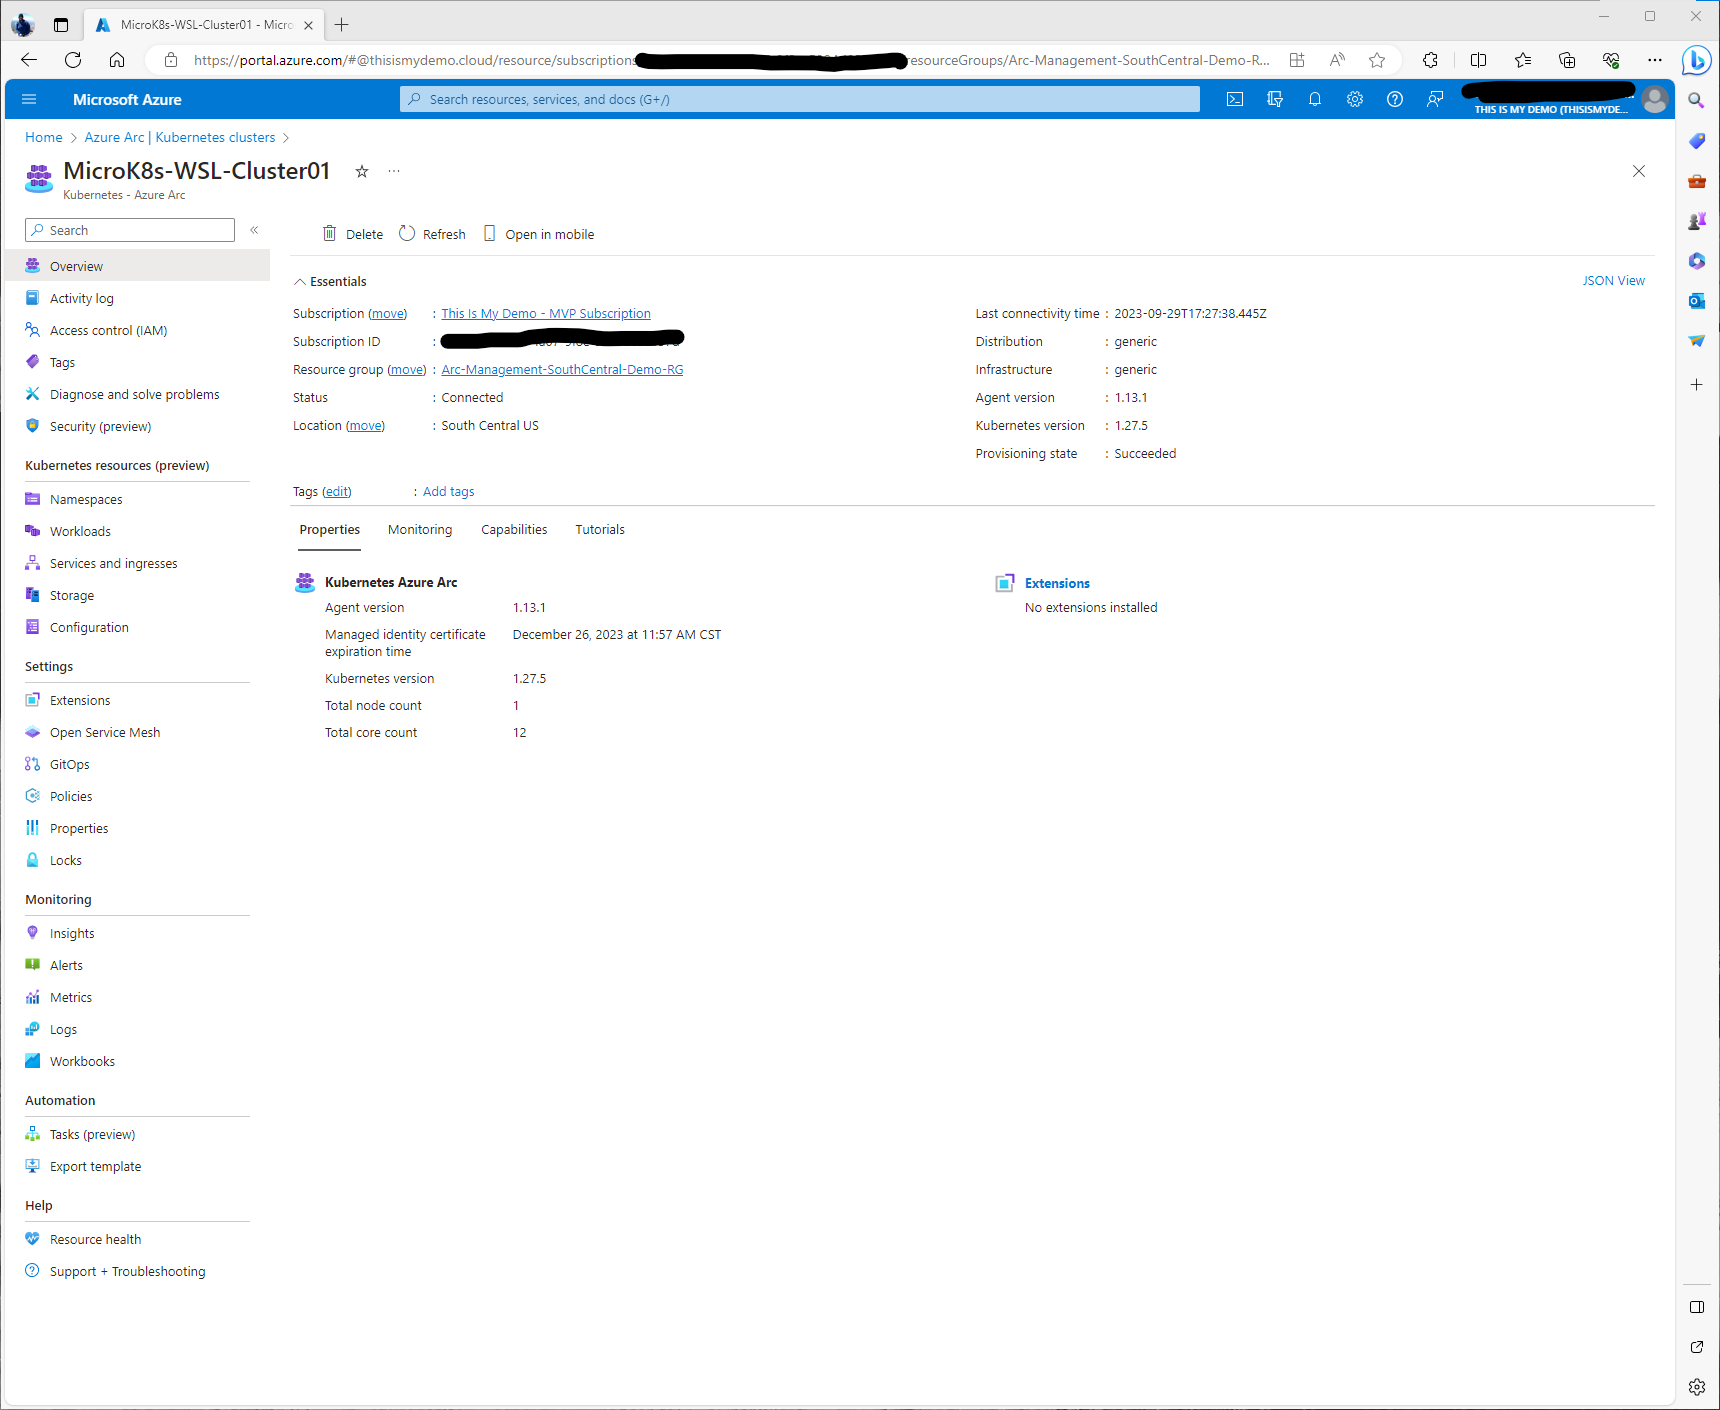
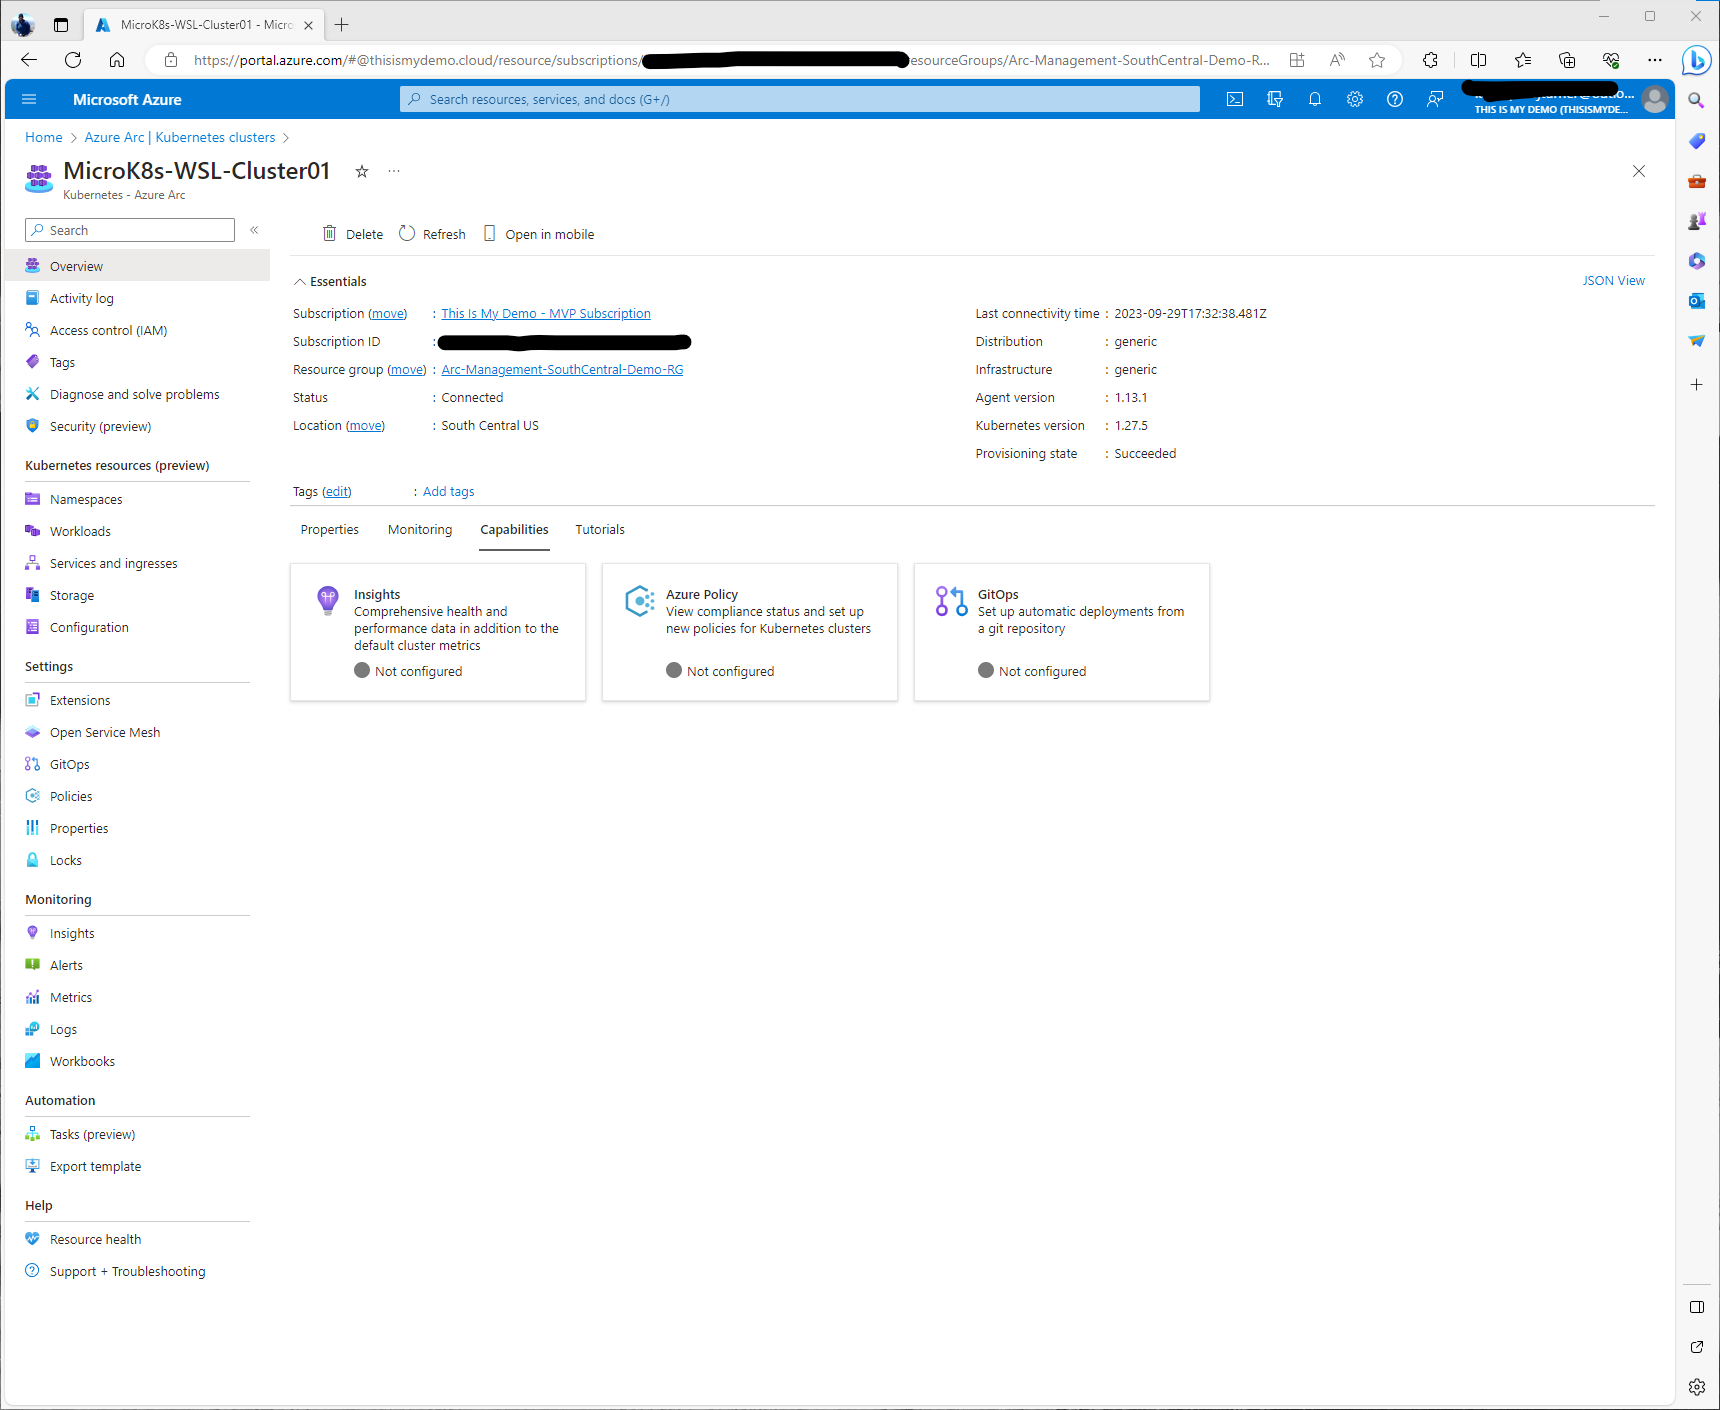
By clicking on the resource, it will open into the overview window. Here I can see that under Status it is still in a Connected Status. Underneath that status section there are some tabes that allow us to get more information about this cluster, it’s properties, a high level view of monitoring, and some of its capabilities.
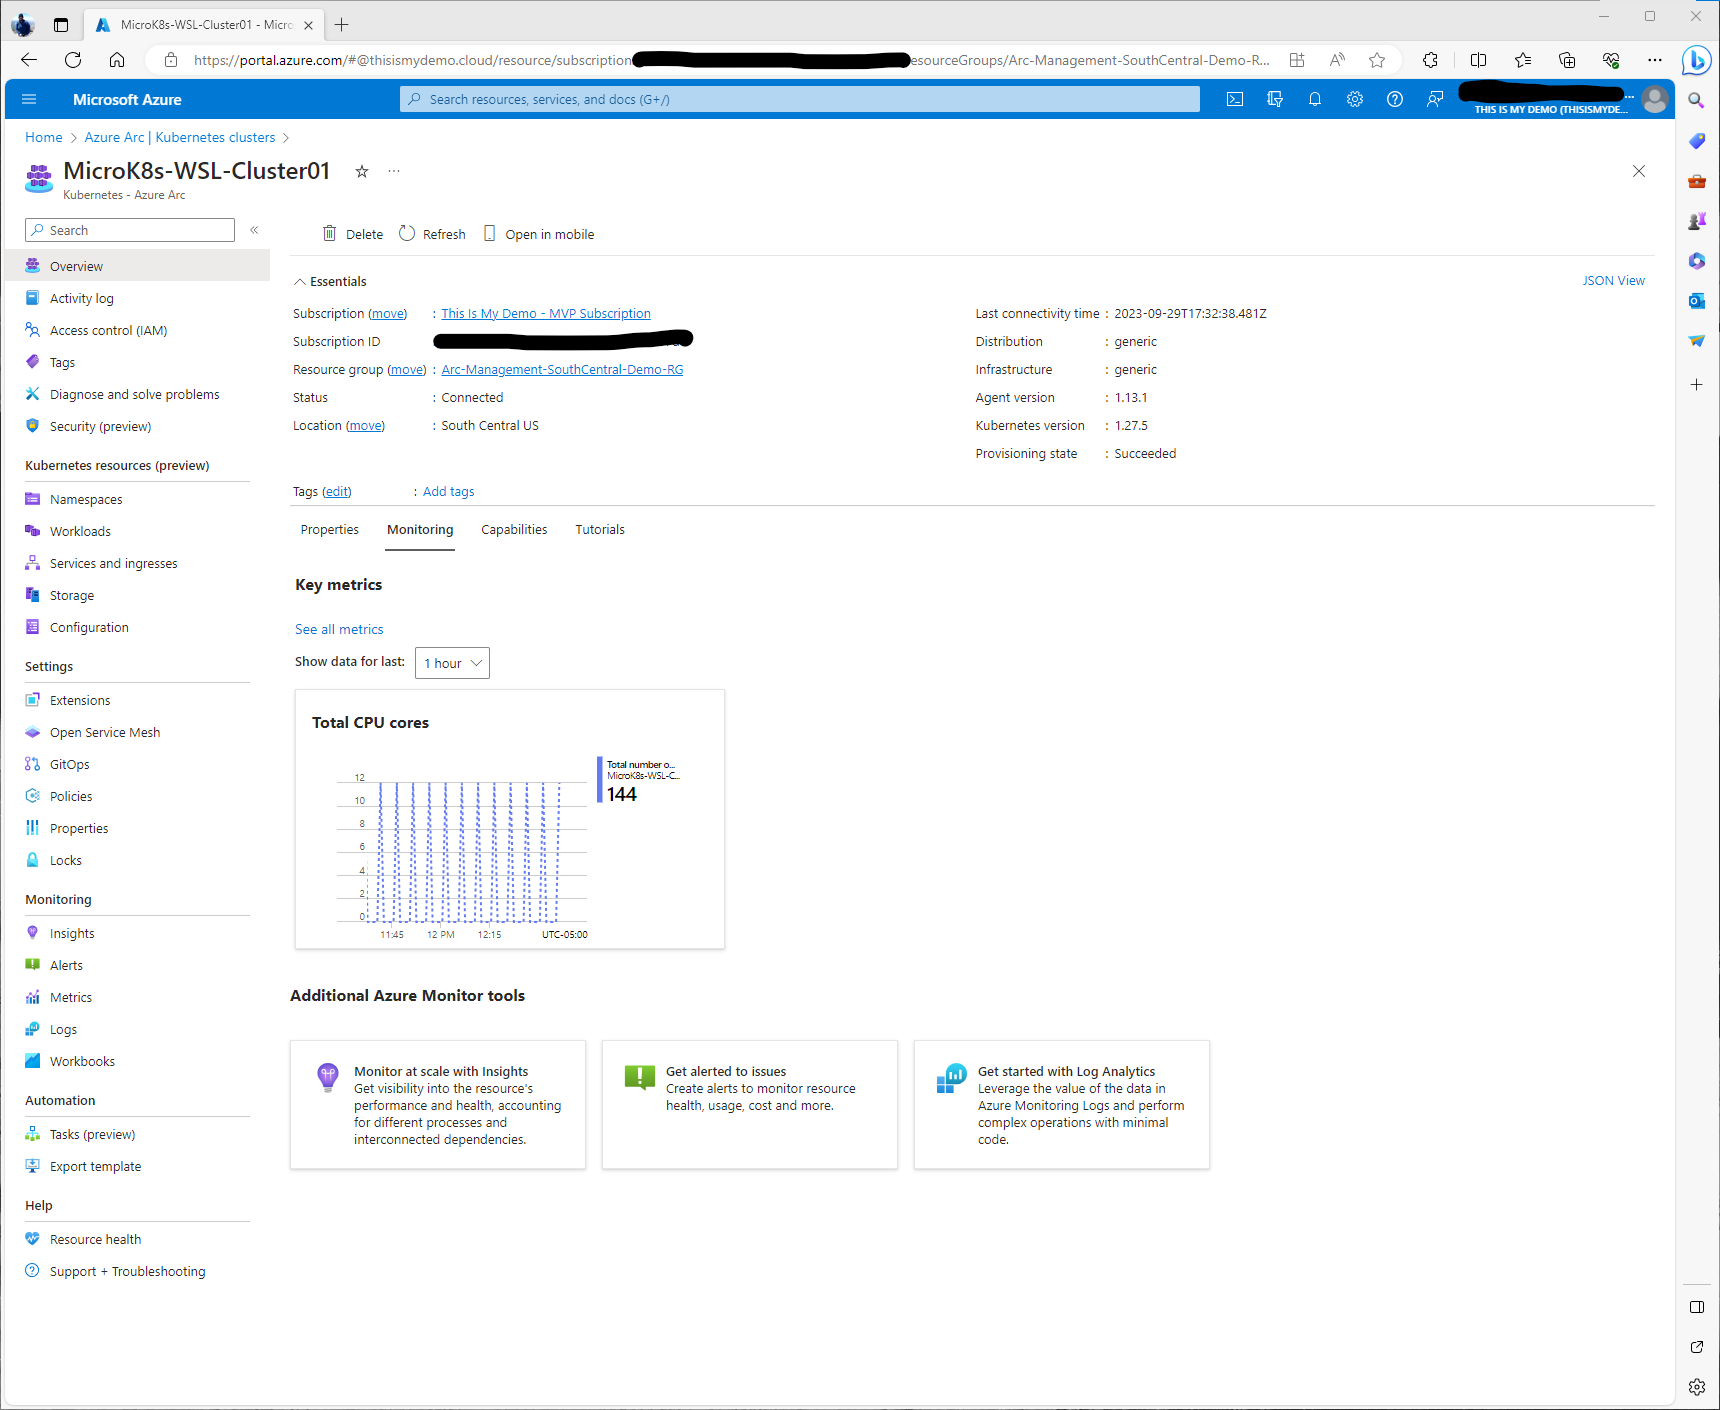
Under the Monitoring tab we can pull basic information from Key metrics. However, these are simple metrics and we really want to dig deeper into monitoring our cluster. This same windows has some information about additional tools from Azure Monitor as well.
The Capabilities tab shows some of the available capabilities that can be enabled from the portal, including Insights, which is what I am covering in this blog. Azure Policy which I will cover in another blog, and using GitOps to setup automatic deployments from a git repository, which again, I will cover in this series as well.
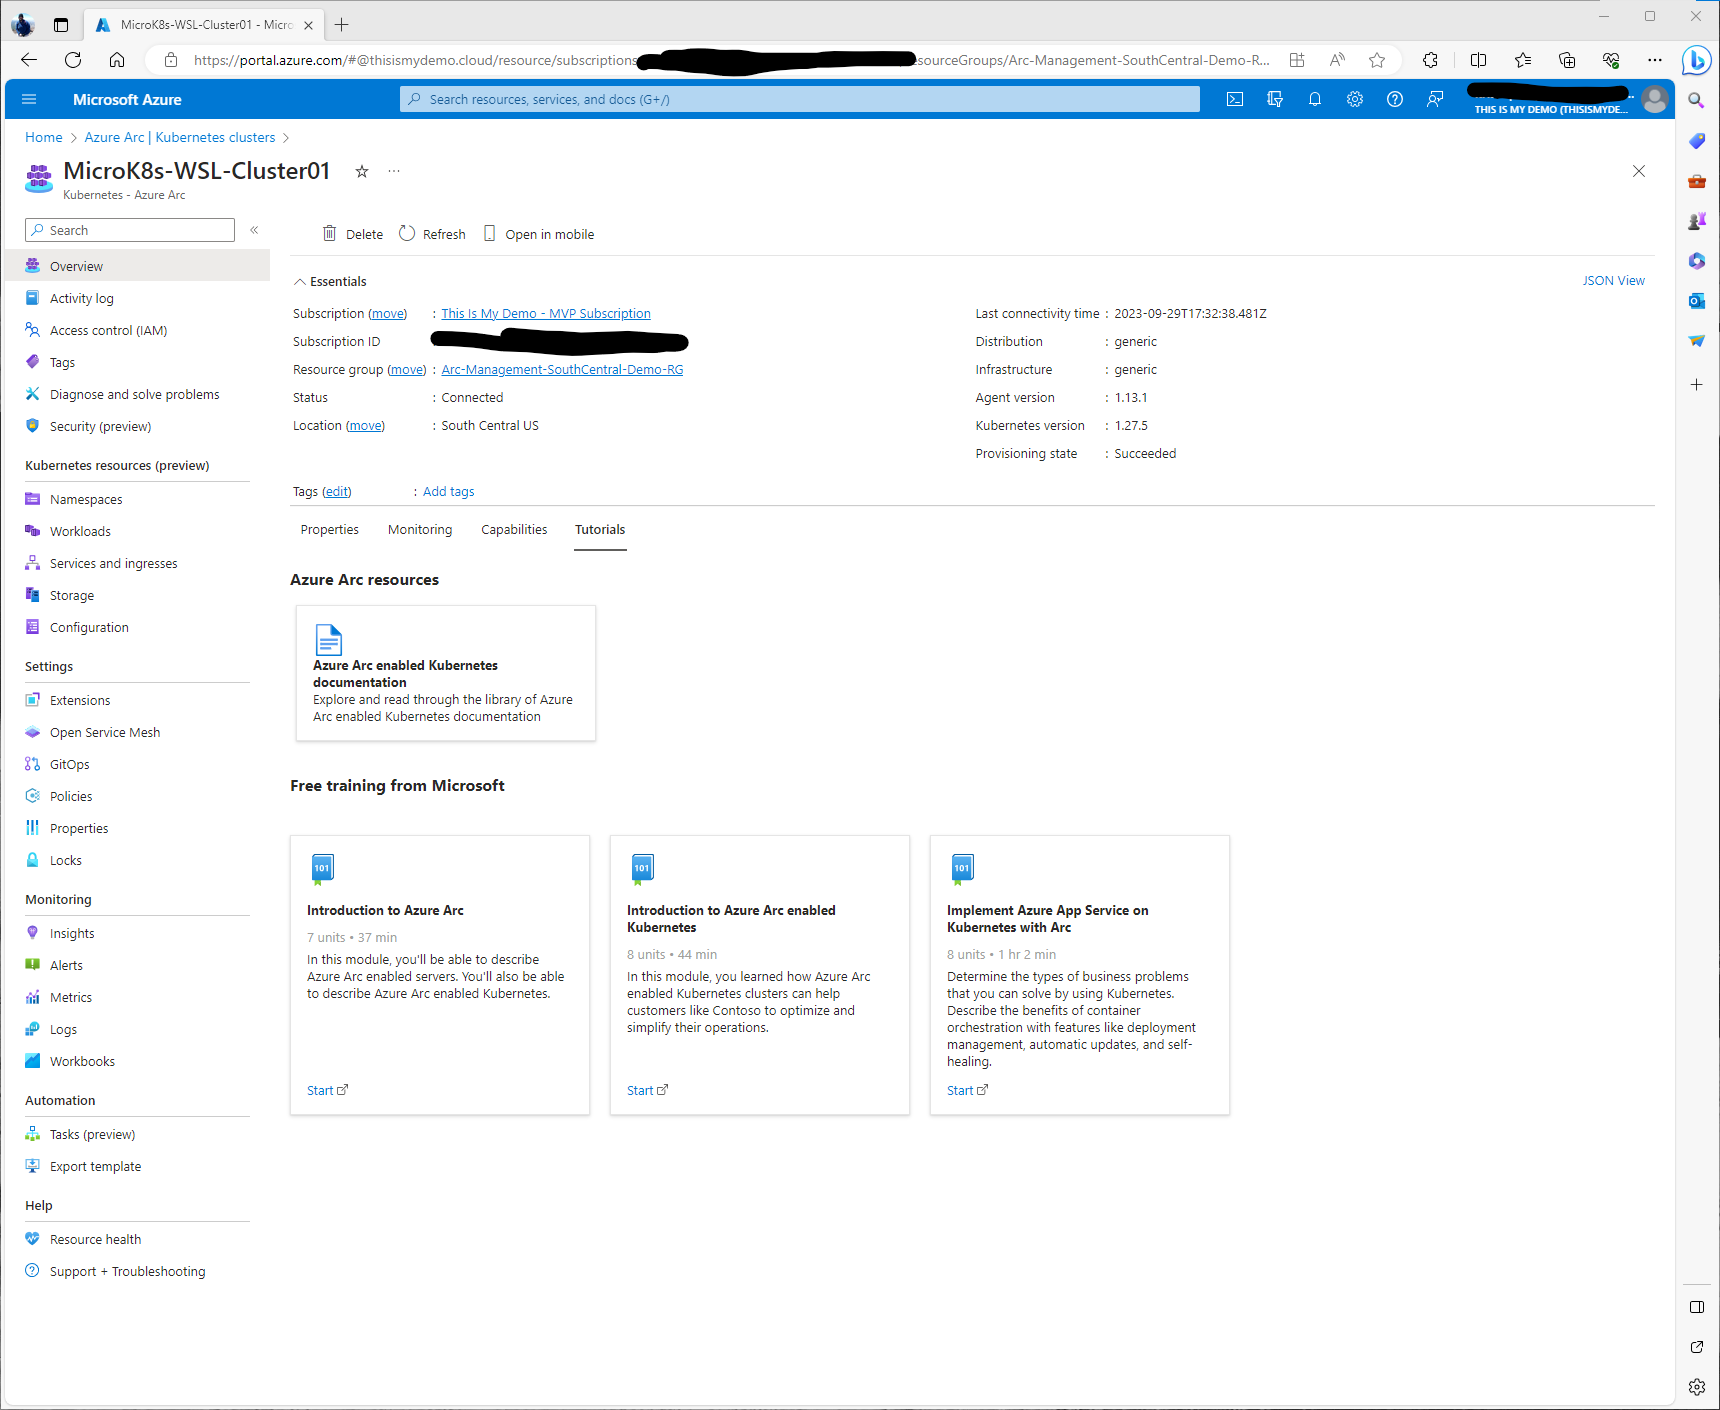
The last tab list a number of good resources for tutorials. I highly recommend if you are new to Azure Arc to take advantage of some of the free training mentioned in those links.
So that was a quick overview of the Cluster and the Azure Portal. Let’s get started with the fun.
So to keep it simple, I followed a few different blogs to help fill in areas that my skill set was lacking, mainly because my memory in my head can’t hold more than a days worth of memory so I had slightly forgotten how to do a lot of this. I did refer back to Azure Monitor Container Insights for Azure Arc enabled Kubernetes clusters Microsoft Learn Documentation as well.
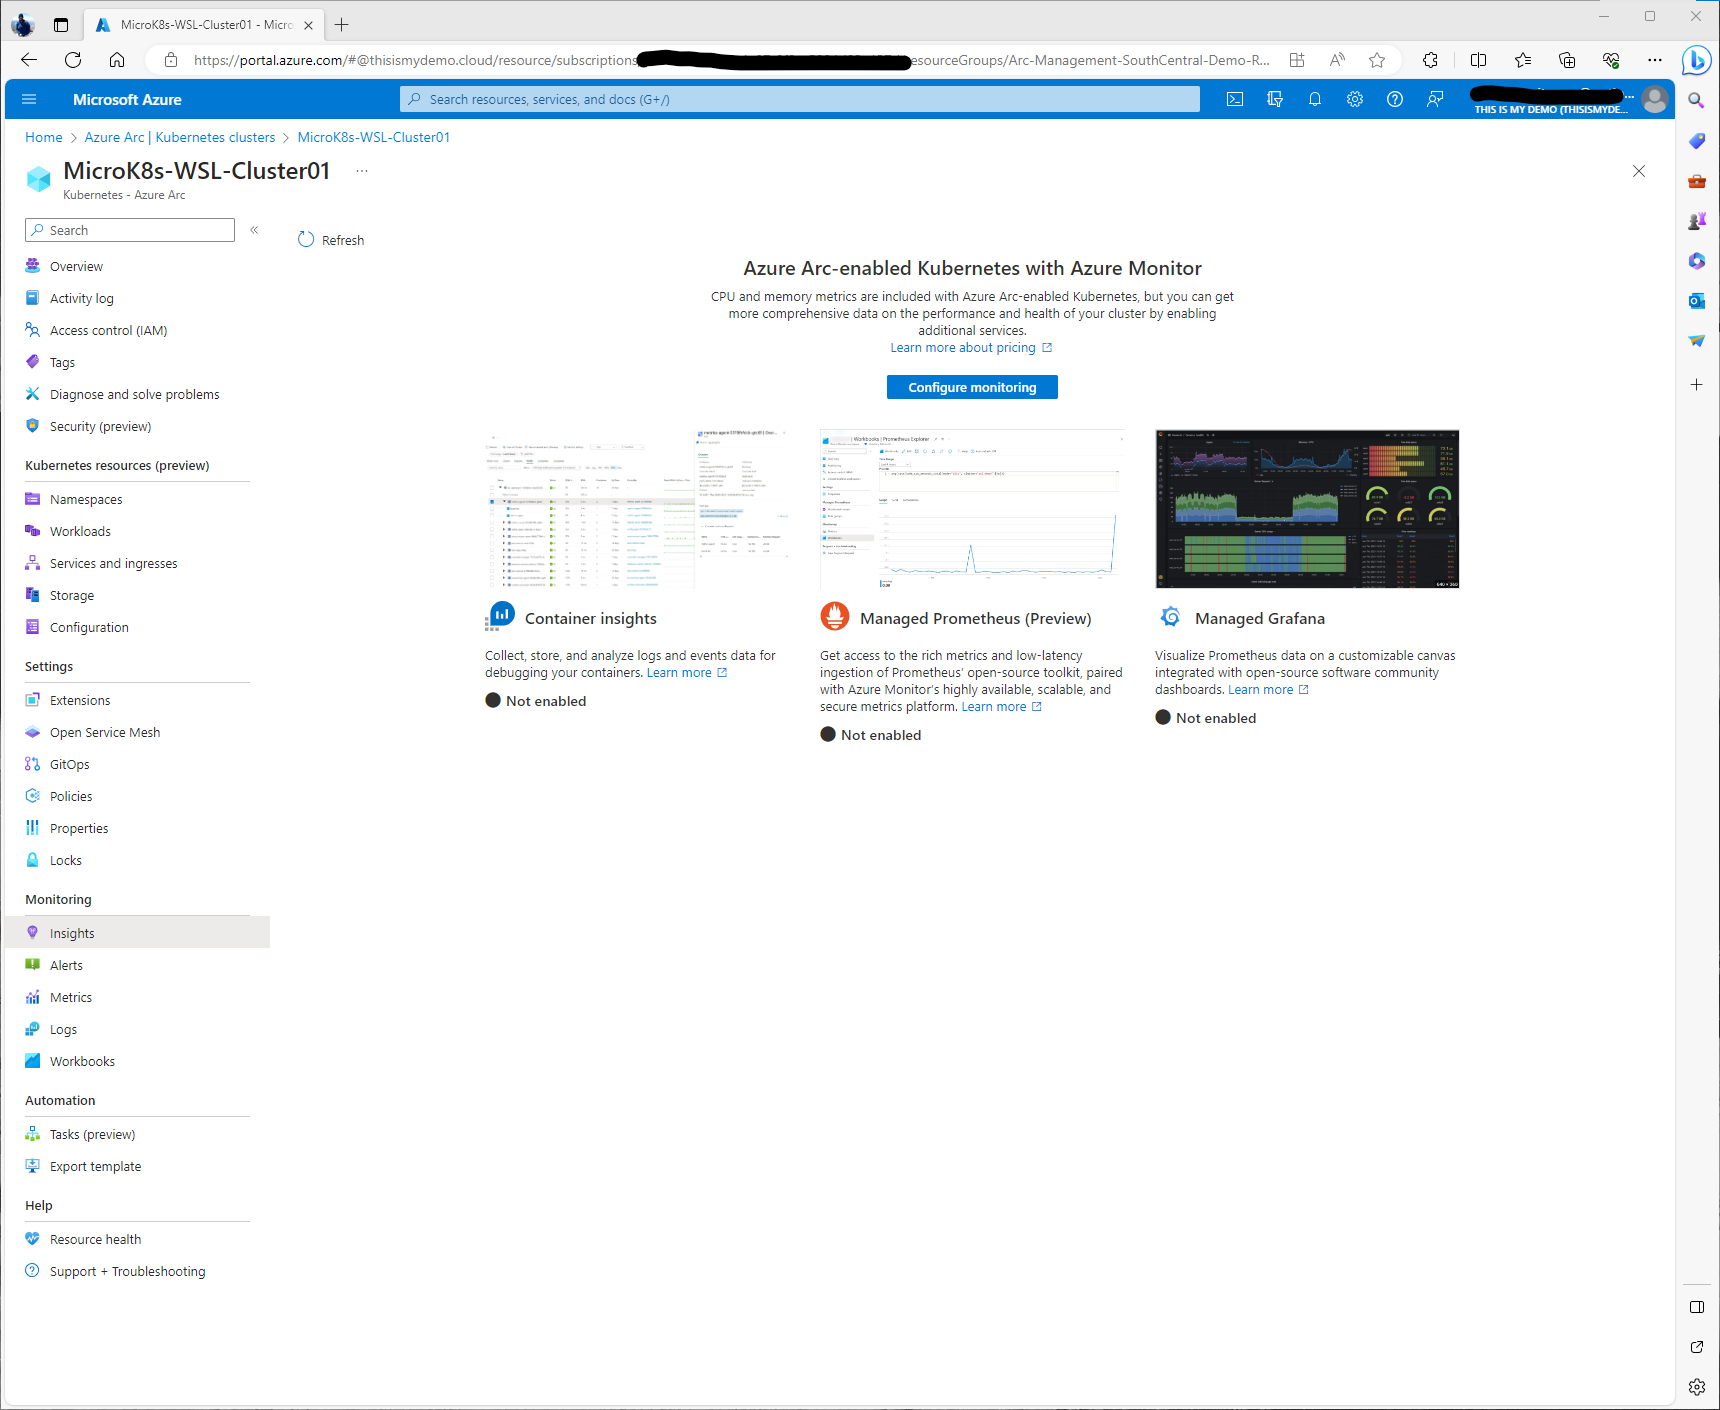
So I started in the Azure Portal, within the Azure Arc blade, and opened up my cluster resource which could be found under Kubernetes section of the Infrastructure area. Here I went to Insights under the Monitoring section on the left menu. This windows has a lot more information about Container Insights, Managed Prometheus, and Managed Grafana.
Enabling Container Insights (Prometheus and Grafana)
Before we start there are some prerequisites that will need to be completed.
- A Log Analytics workspace is needed
- An Azure Monitor workspace is needed
- A Grafana Instance (Can be configured during configuration of Insights)
In my case this is a demo environment, but in real world situation we would need to consider a few different things like Role assignments that are needed for the Log Analytics workspace, for those that want to view or monitor the data, and to make sure our endpoints have been enabled and have access. For example, my cluster would need to have access to some of the Azure public cloud endpoints on port 443. So some firewall configurations would need to be made if I was running this in an environment that wasn’t my Windows laptop running WSL.
Also, I want to call out, that a majority of this that I am doing is going to be via the portal. The Microsoft Learn Documentation has more details on how to do this all through Azure CLI or PowerShell or even via ARM Templates.
I have created a Log Analytics workspace in the past for my Microsoft Sentinel demos. I am going to just reuse that for this blog. I probably wouldn’t do this in a real lab, development or production environment because this will add data egress and ingestion cost to the workspace. Unless you had signed up for a commitment tier this could start to get pricy at the end of the say.
So, I clicked on Configure Azure Monitor, and the Configure Container insights window pops up. Here I will expand Advanced settings so I can configure the Azure Monitor Workspace and Log Analytics Workspace I want to use. Also, I want to make sure my cost presets are set correctly. I will also crate a new Grafana Instance from this window as well.
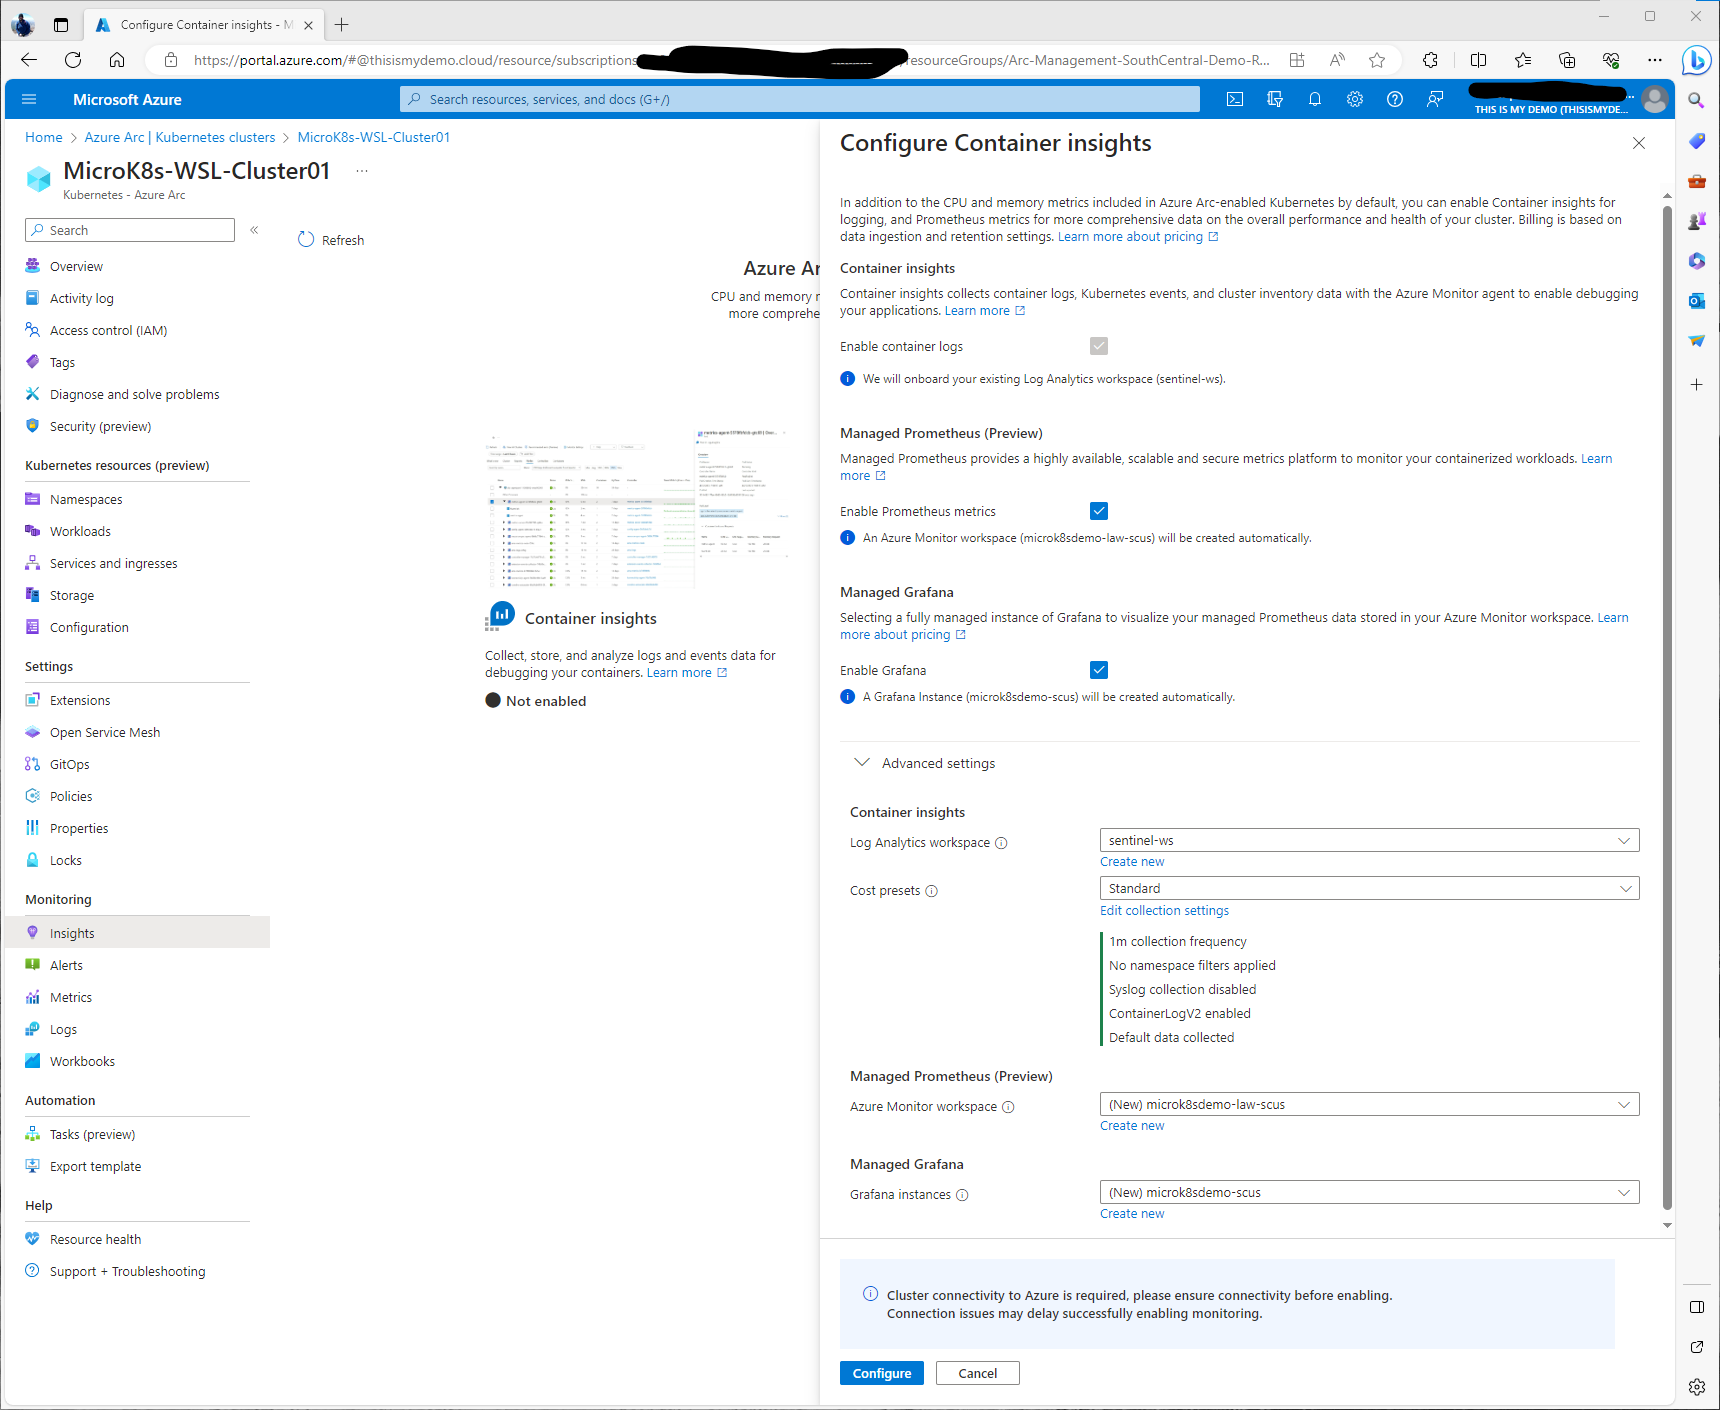
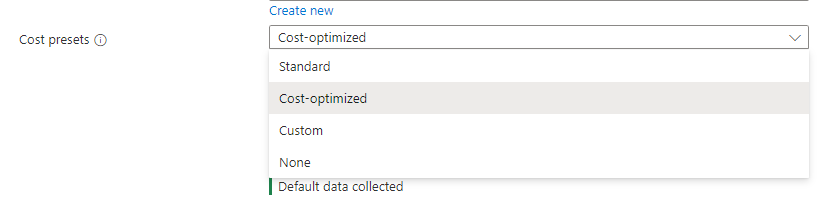
Under cost presets we have a choice to select different levels of collection. There are some preset settings like Standard, Cost-optimized, custom, or none. I will select Standard for this demo.
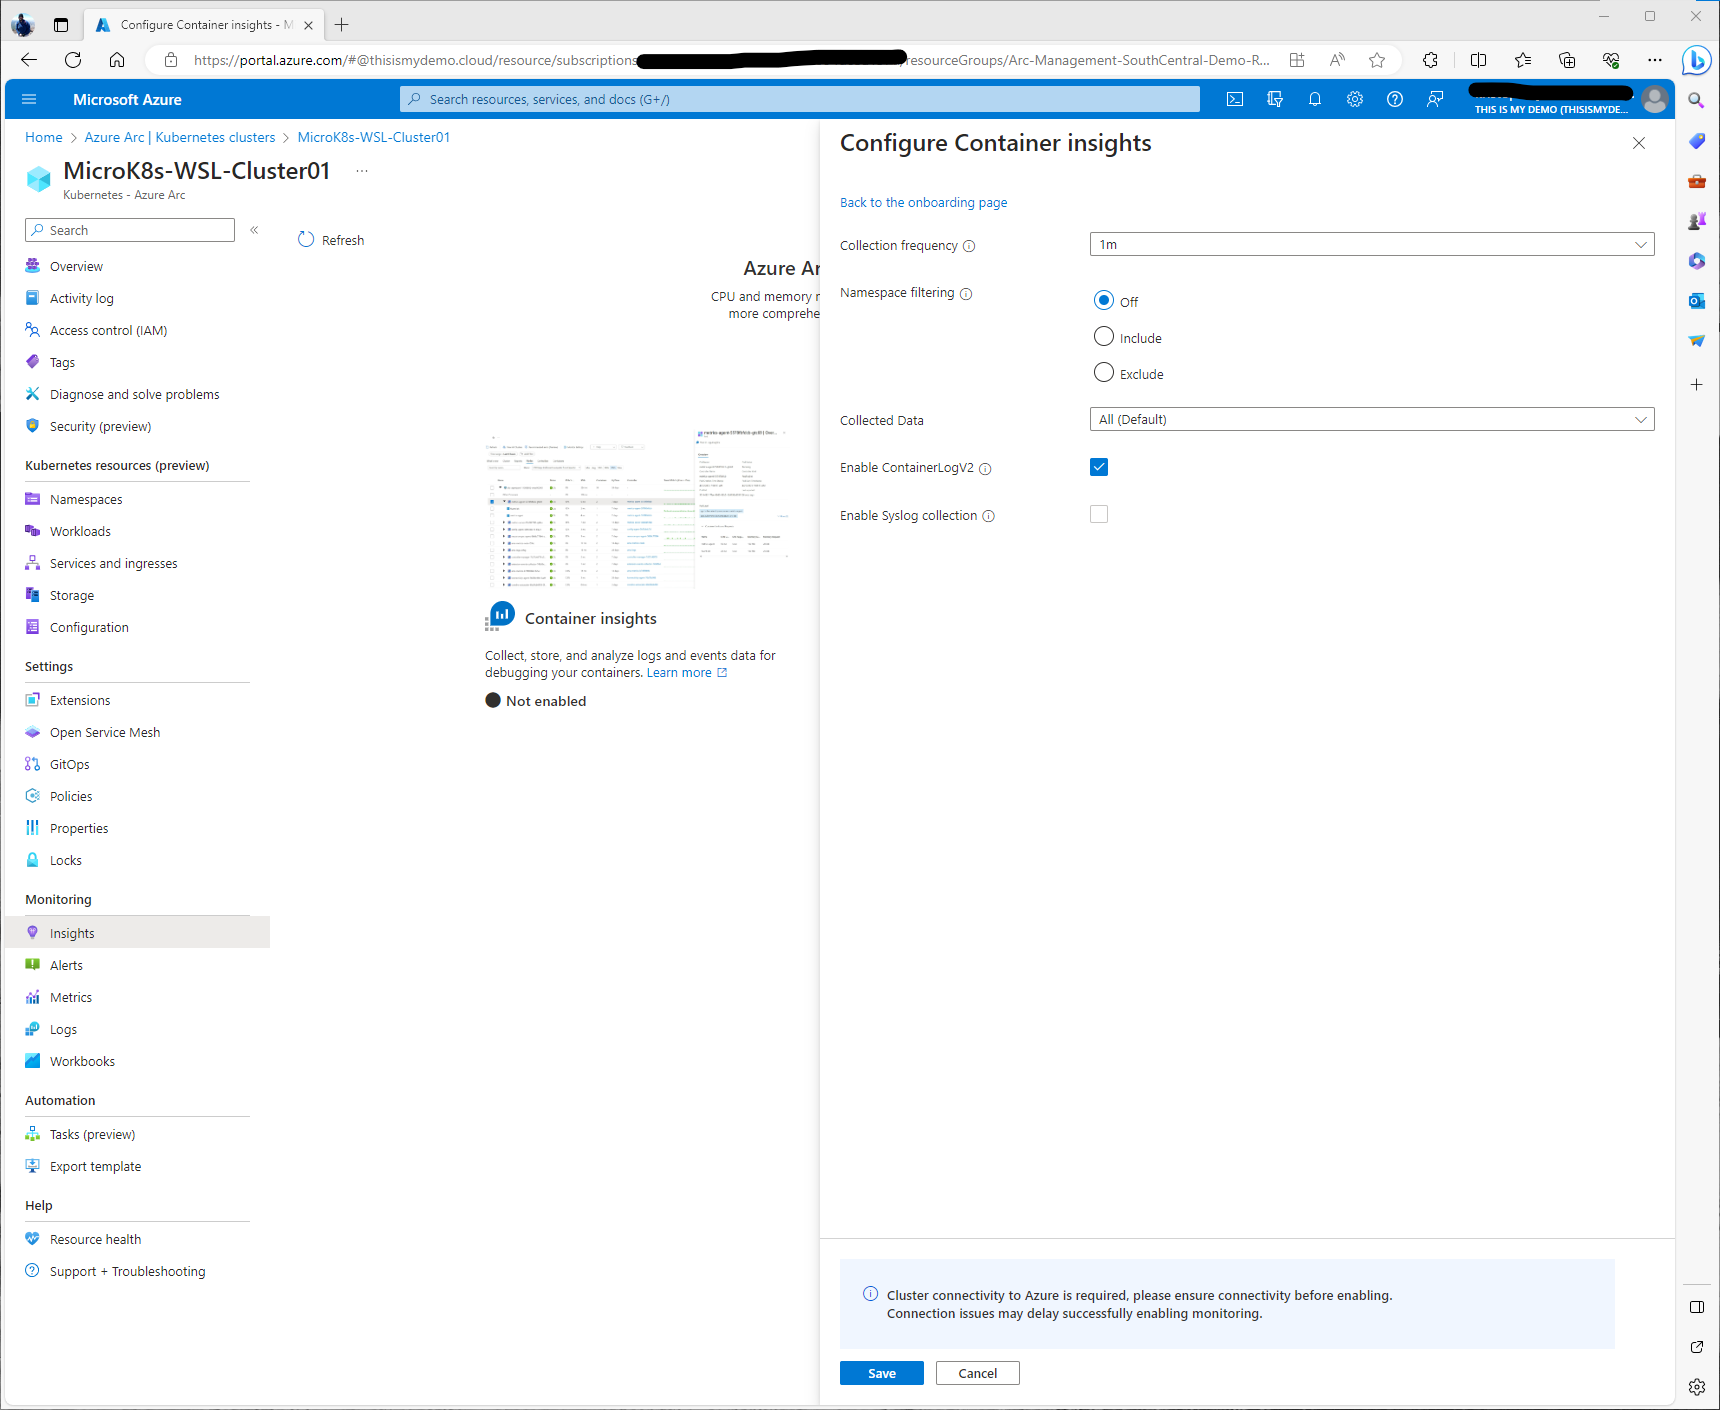
If I click on Edit collection settings we can see some of the extra configurations we can do to either collect more data or limit what we collect to help with cost optimization.He I can change the collection frequency, I can enabled namespace filtering. So can include or exclude namespaces that I only want to collect data from. I can enable ContainerLogV2, which by default that is enabled. I can also enable Syslog collection since this is a Linux machine as well.
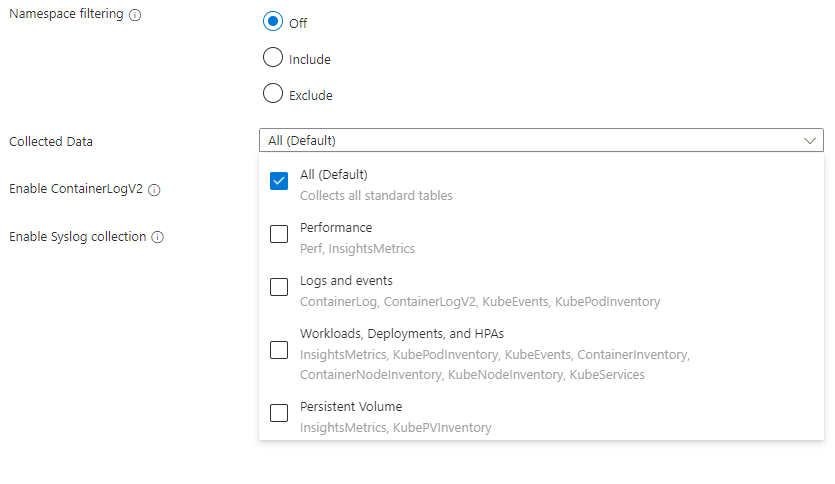
Digging deeper in the Collected Data drop down I can even get more granular on what kind of data I am collecting. For this blog I am leaving Default, All data is collected. I can limit to only collecting Performance data, logs and events, WWorkload data only, and Persistent volume metrics. I am leaving everything default and moving forward.
So I have now selected to enable Container Logs, Prometheus metrics, and enable Grafana. I have selected the Log Analytics workspace I need and have created a new Azure monitor workspace and a new grafana instance. So now I will click Configure at the bottom. And now we just monitor it.
Note: The one thing I do want to call out. Because we did this via the Portal and I didn’t create the Azure Monitor Workspace separately and nor did I create the Grafana Instance manually both of these resources will now show up in the same Resource group where my Azure Arc-enabled Kubernetes cluster is located. This may be ok for the blog, but you may need these resources in different resource groups for various reasons. In that case, doing this via ARM Templates or via Azure CLI would allow us to be more granular. Plus creating these resources before hand would have been more optimal. For my case, it makes it a lot easier to delete all these resources after I finish my blog.
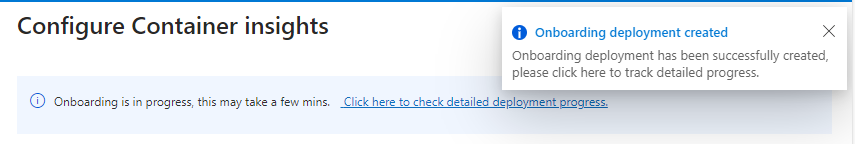
As this deploys and as we monitor the deployment we can also check to see if the extensions had been installed successfully. There are two ways to do this, the first is the portal and the second is using Azure CLI.
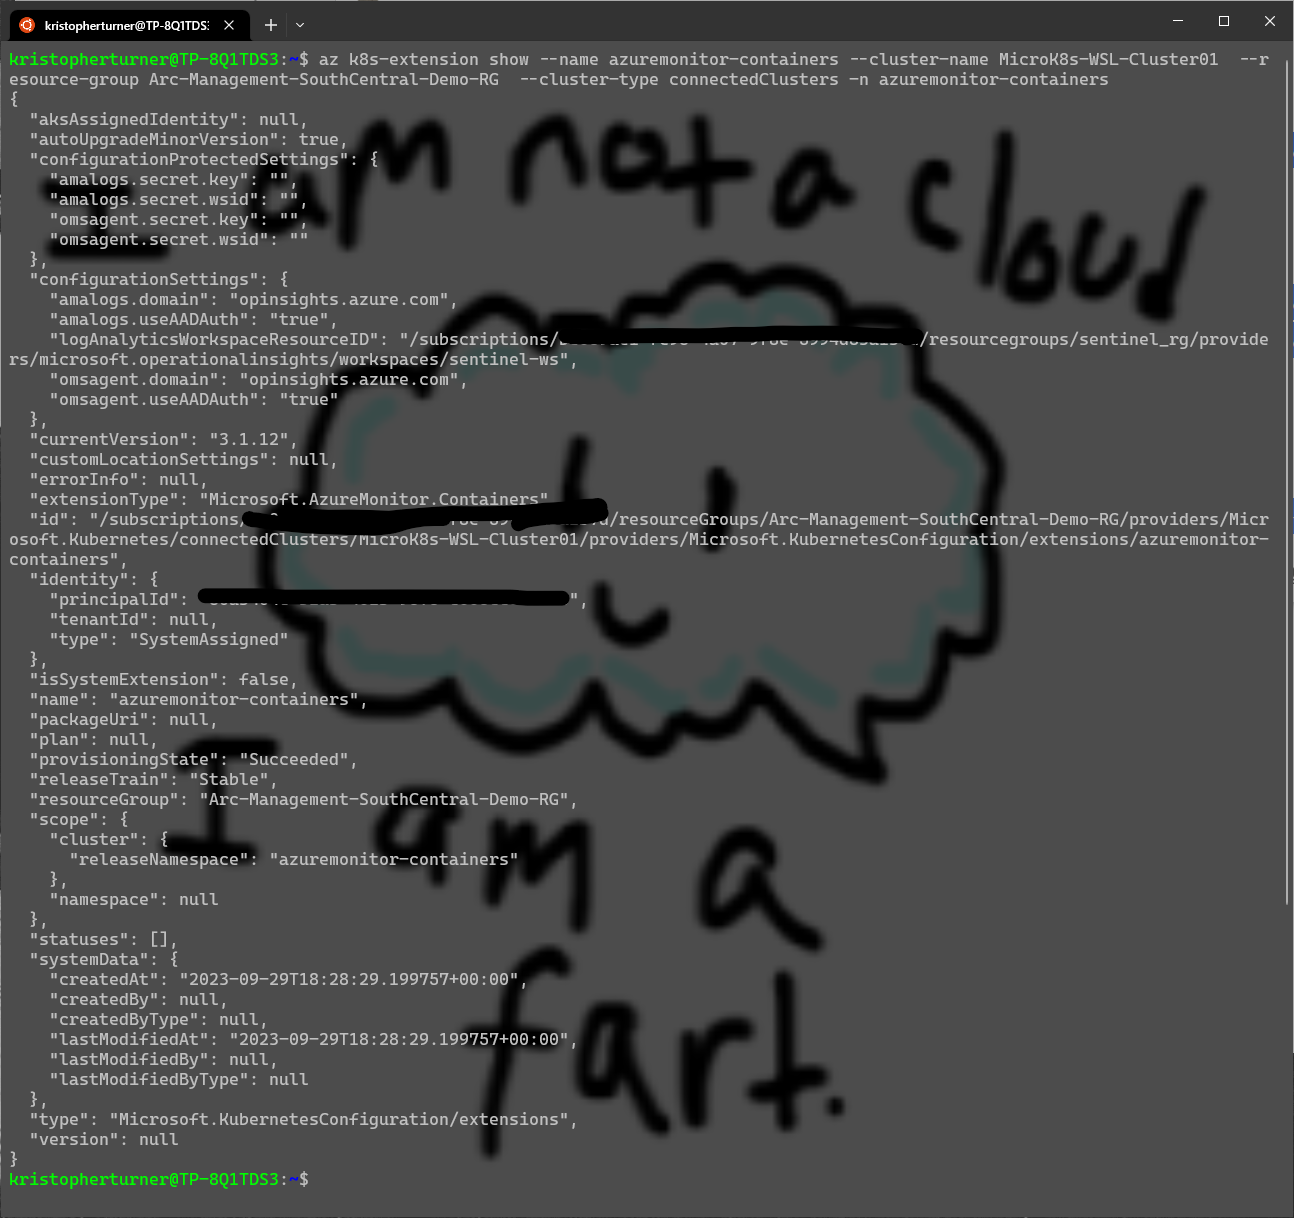
To check via Azure CLI we just need to open our Ubuntu WSL instance and login to the correct subscription and run the following Azure CLI command:
az k8s-extension show --name azuremonitor-containers --cluster-name MicroK8s-WSL-Cluster01  --r
esource-group Arc-Management-SouthCentral-Demo-RG  --cluster-type connectedClusters -n azuremonitor-containers
Note to self, in future demos, make the cluster name shorter and the resource group name shorter. :)
Here we can see the two extensions that have been installed, Azuremonitor-metrics and Azuremonitor-Containers.
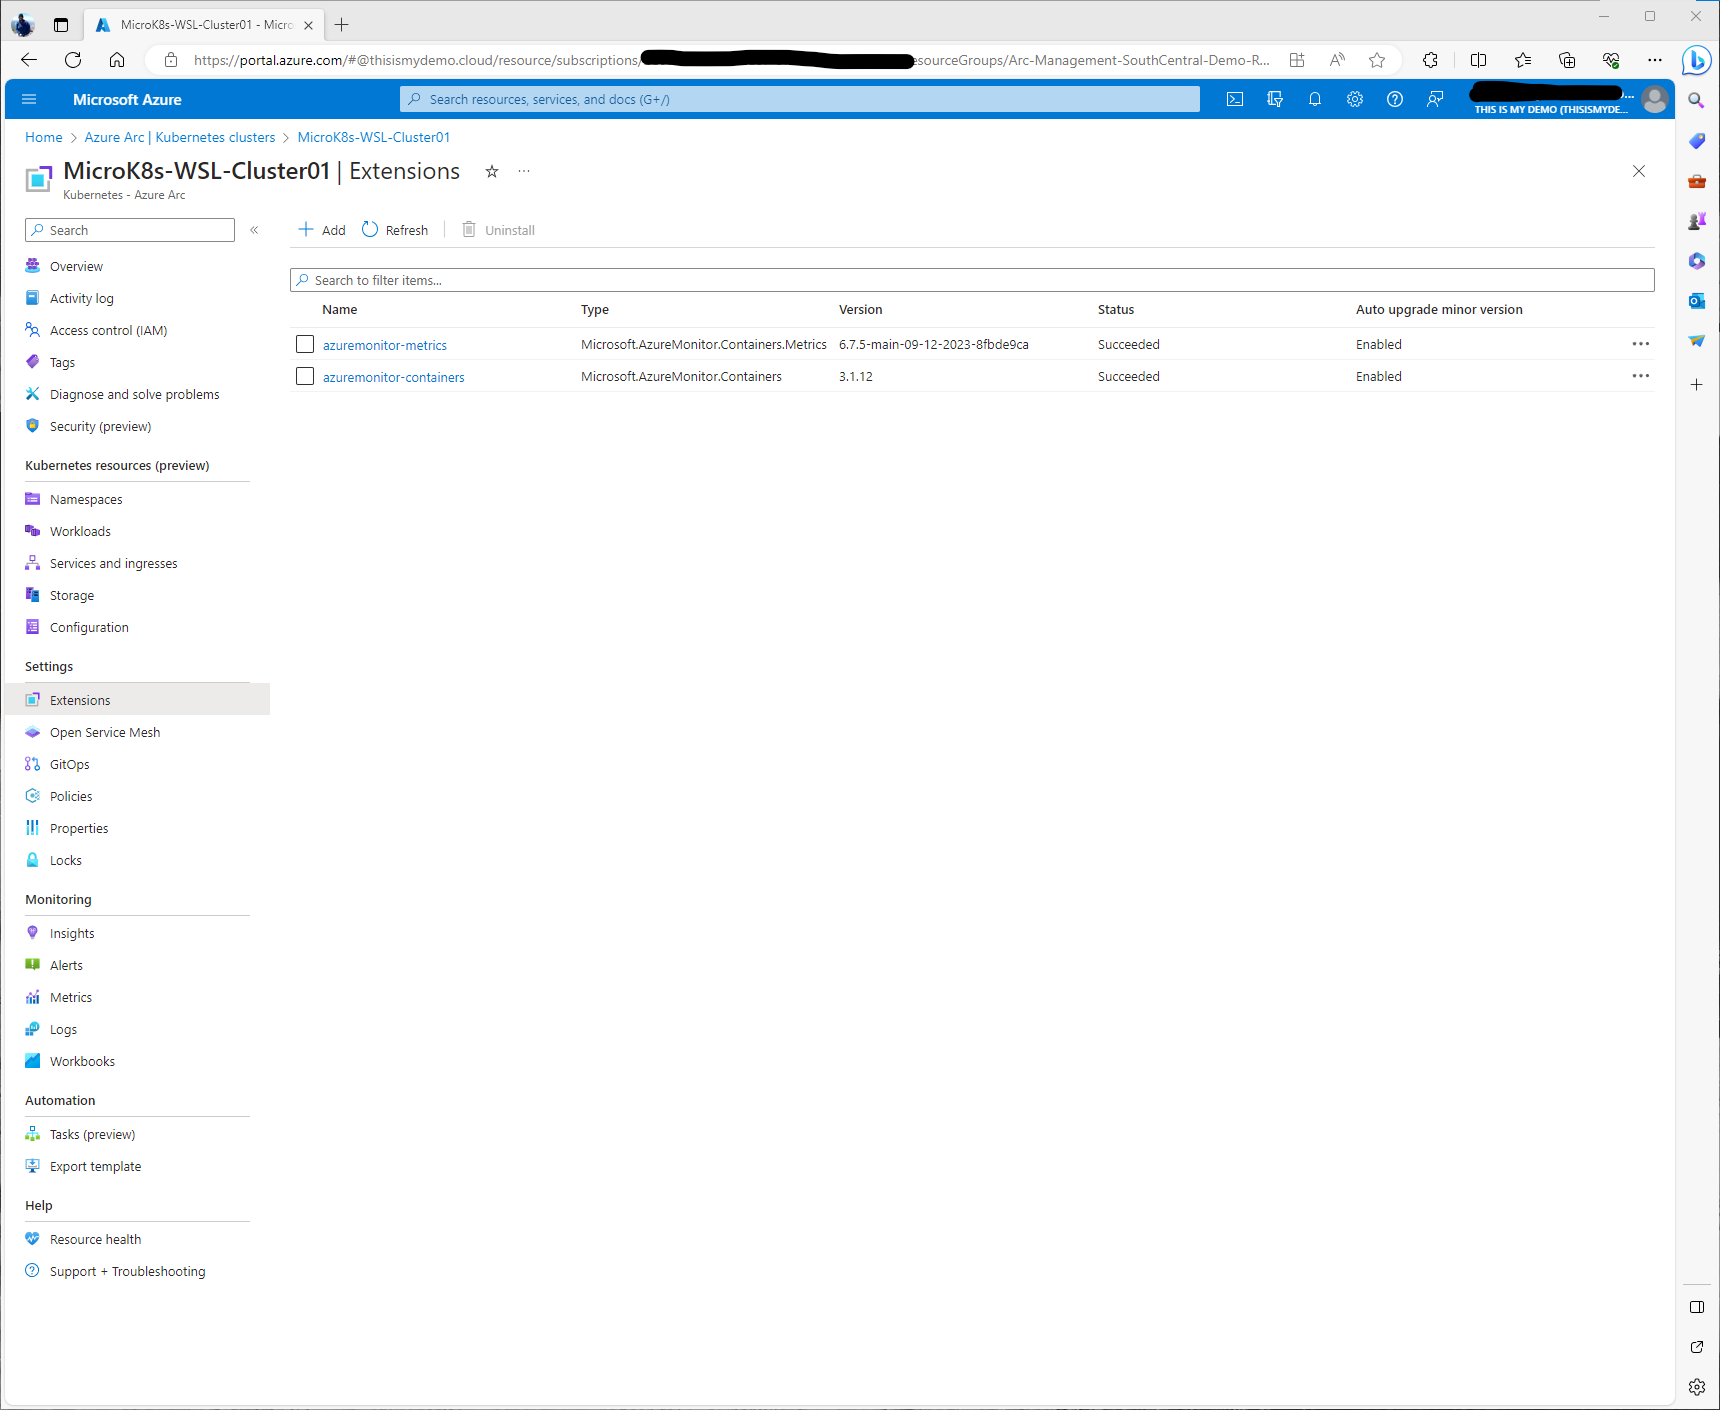
From within the Azure Portal, we can go back to our Azure Arc Resource and under Settings click on Extensions.
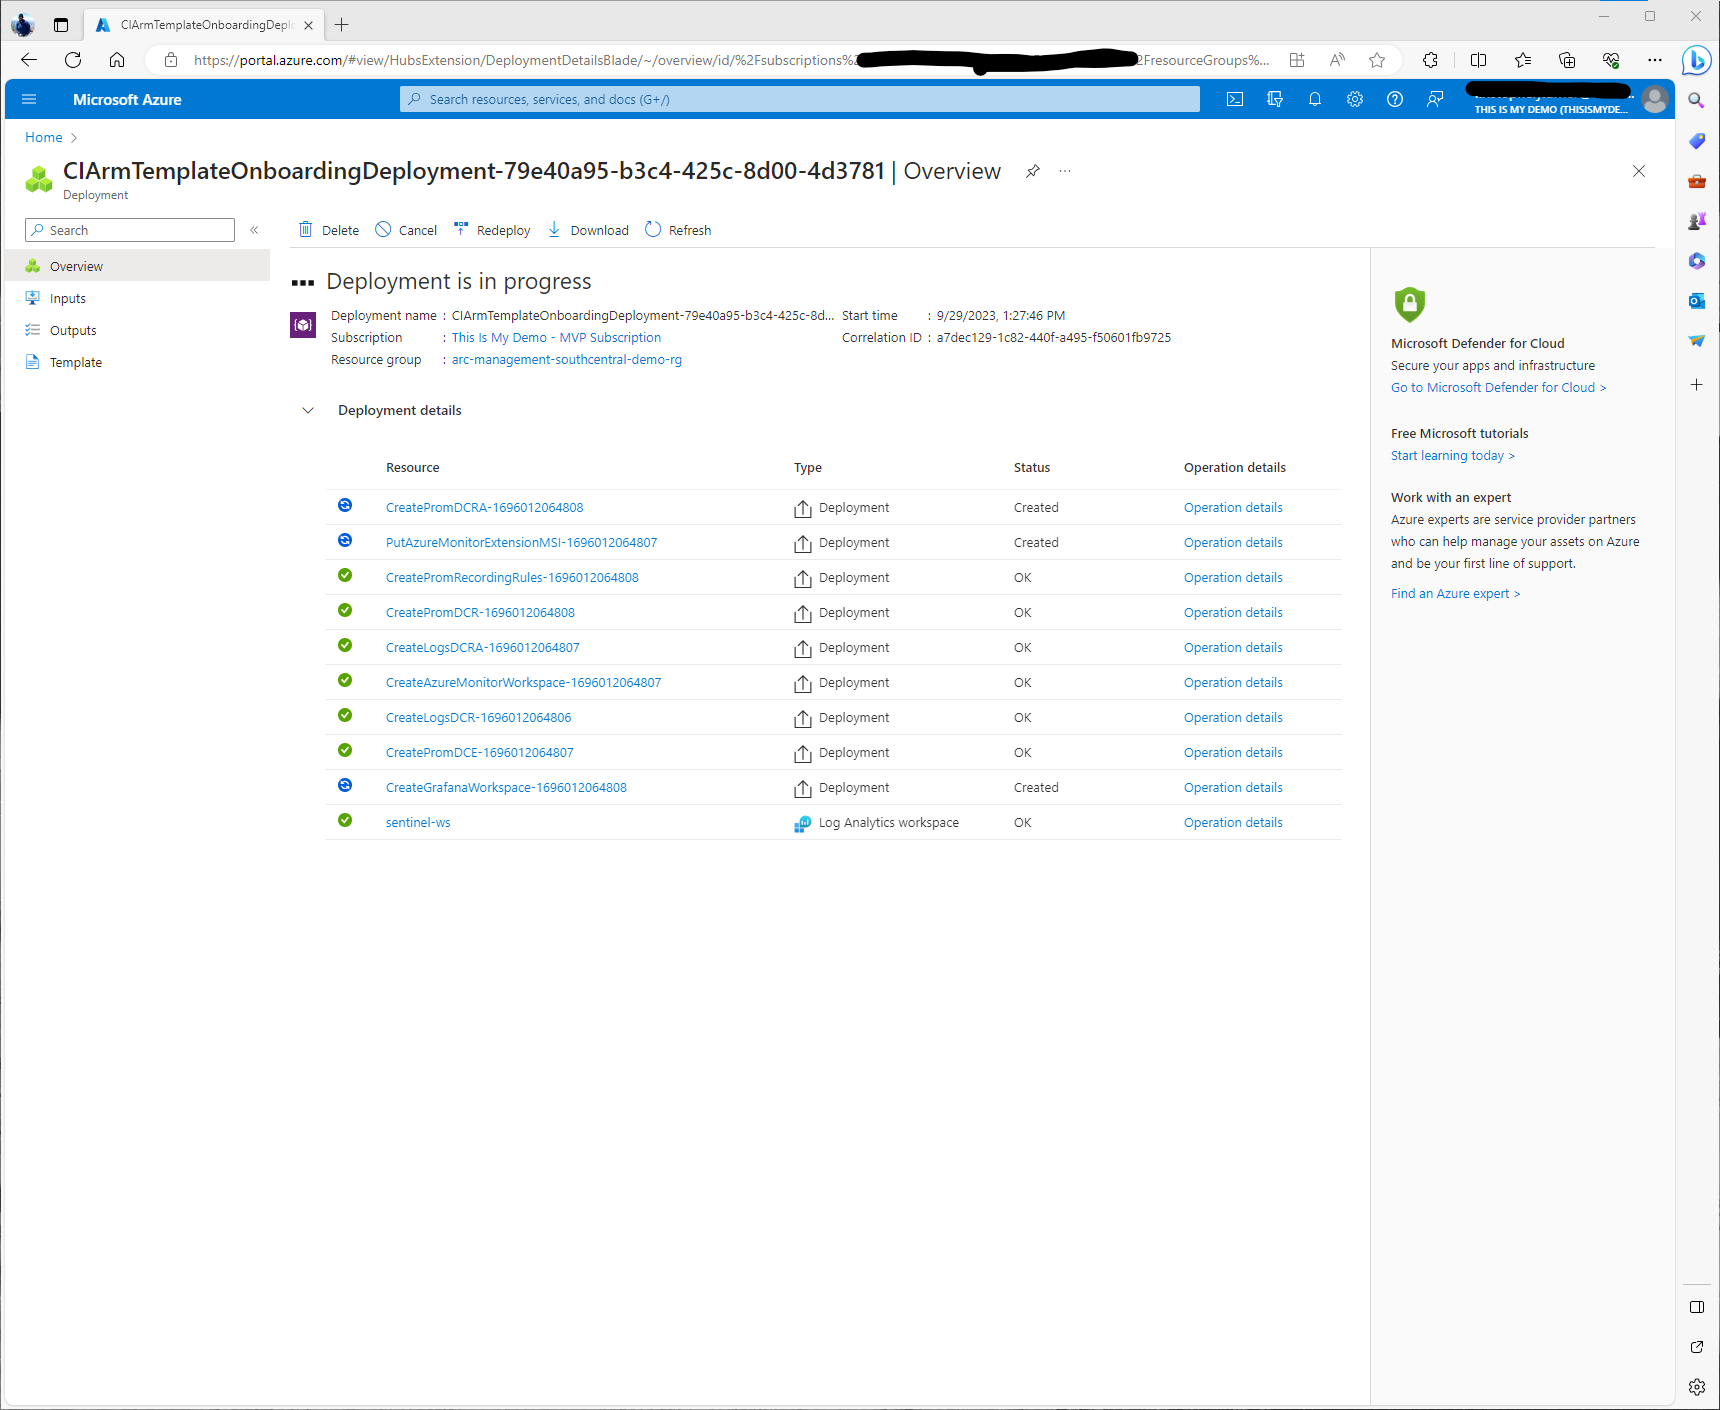
Now all the resources have successfully been deployed. We can check in with the Deployments to verify. Everything looks good when it is all green!
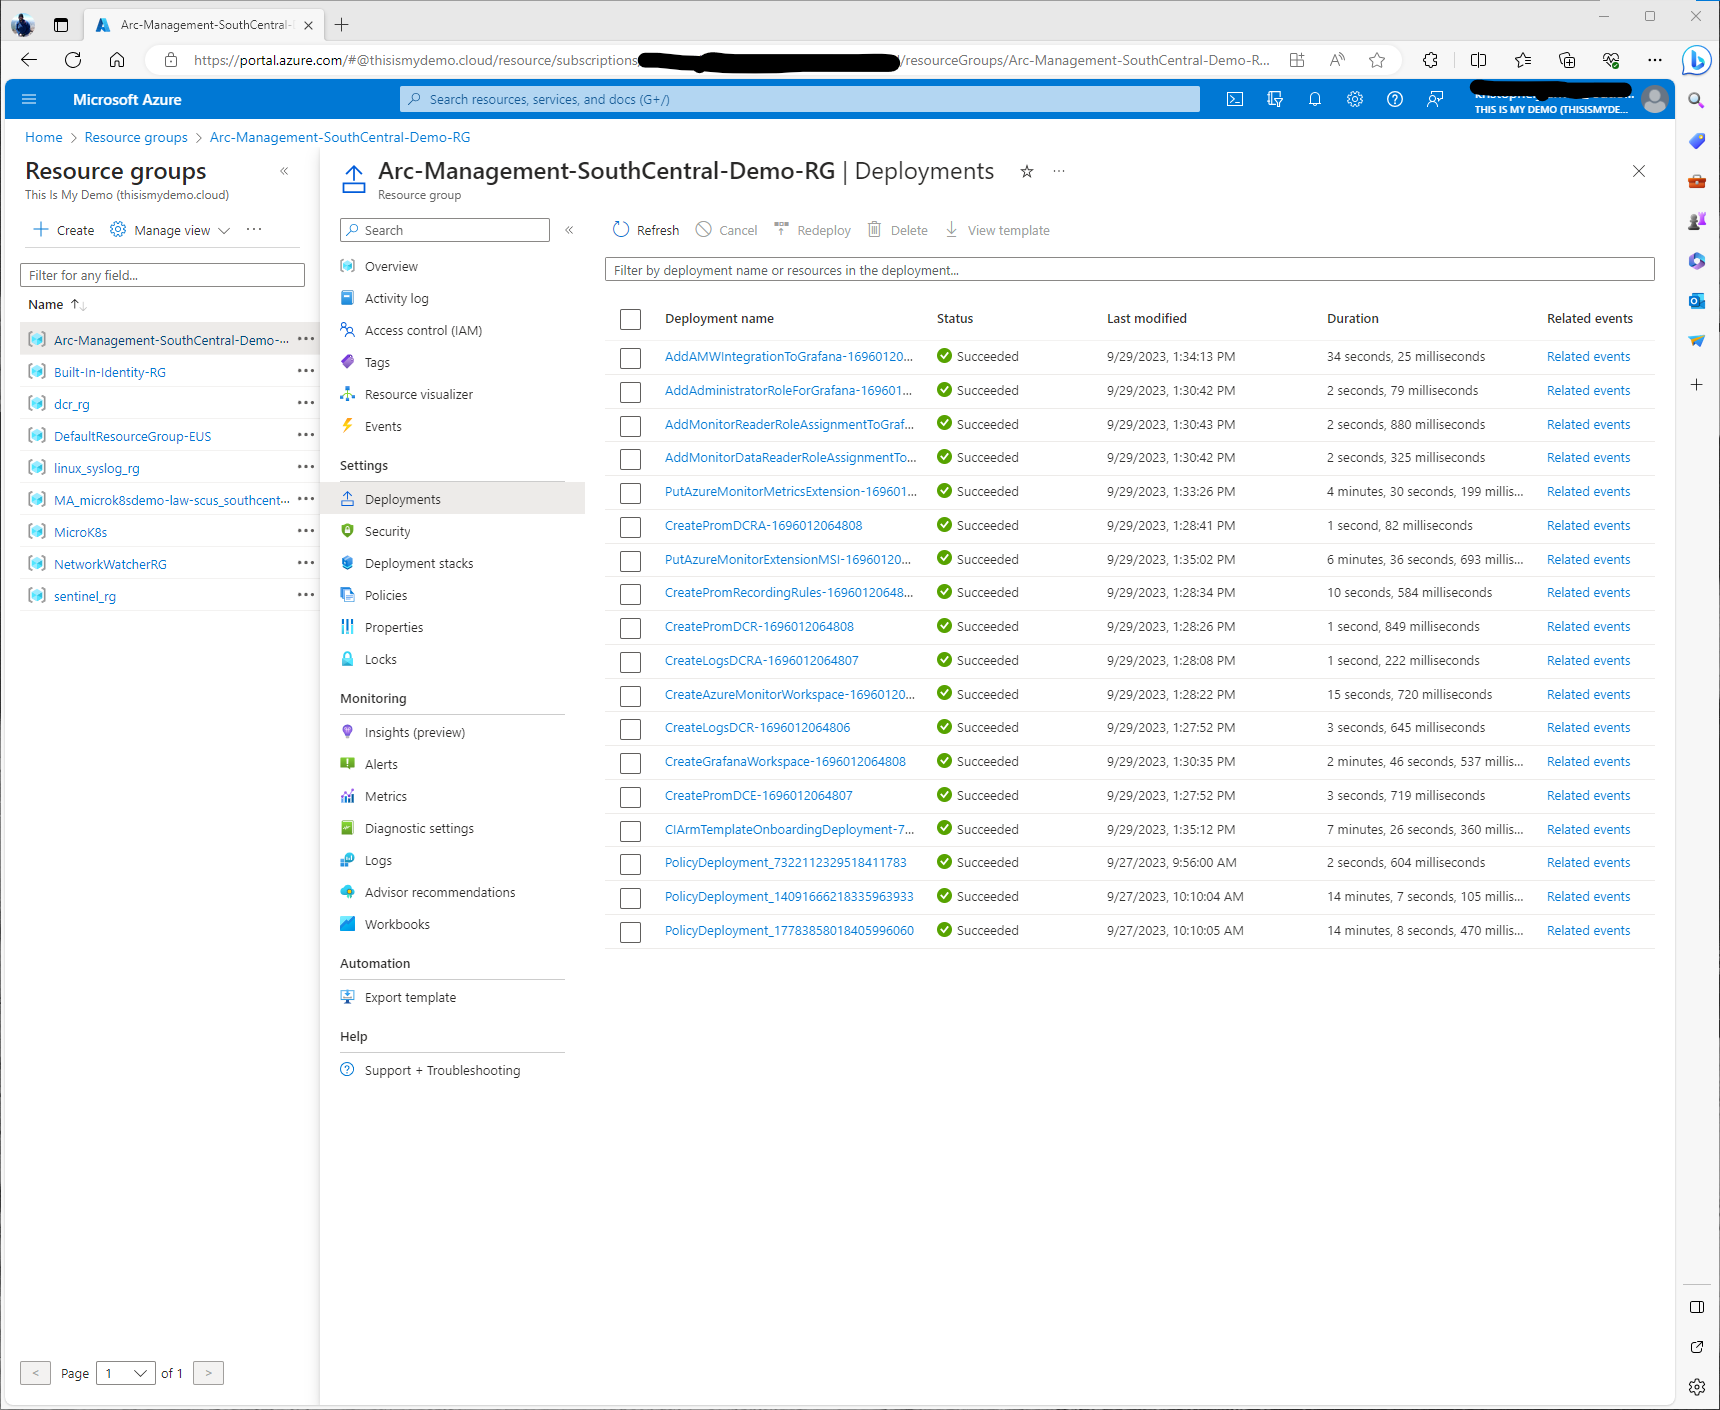
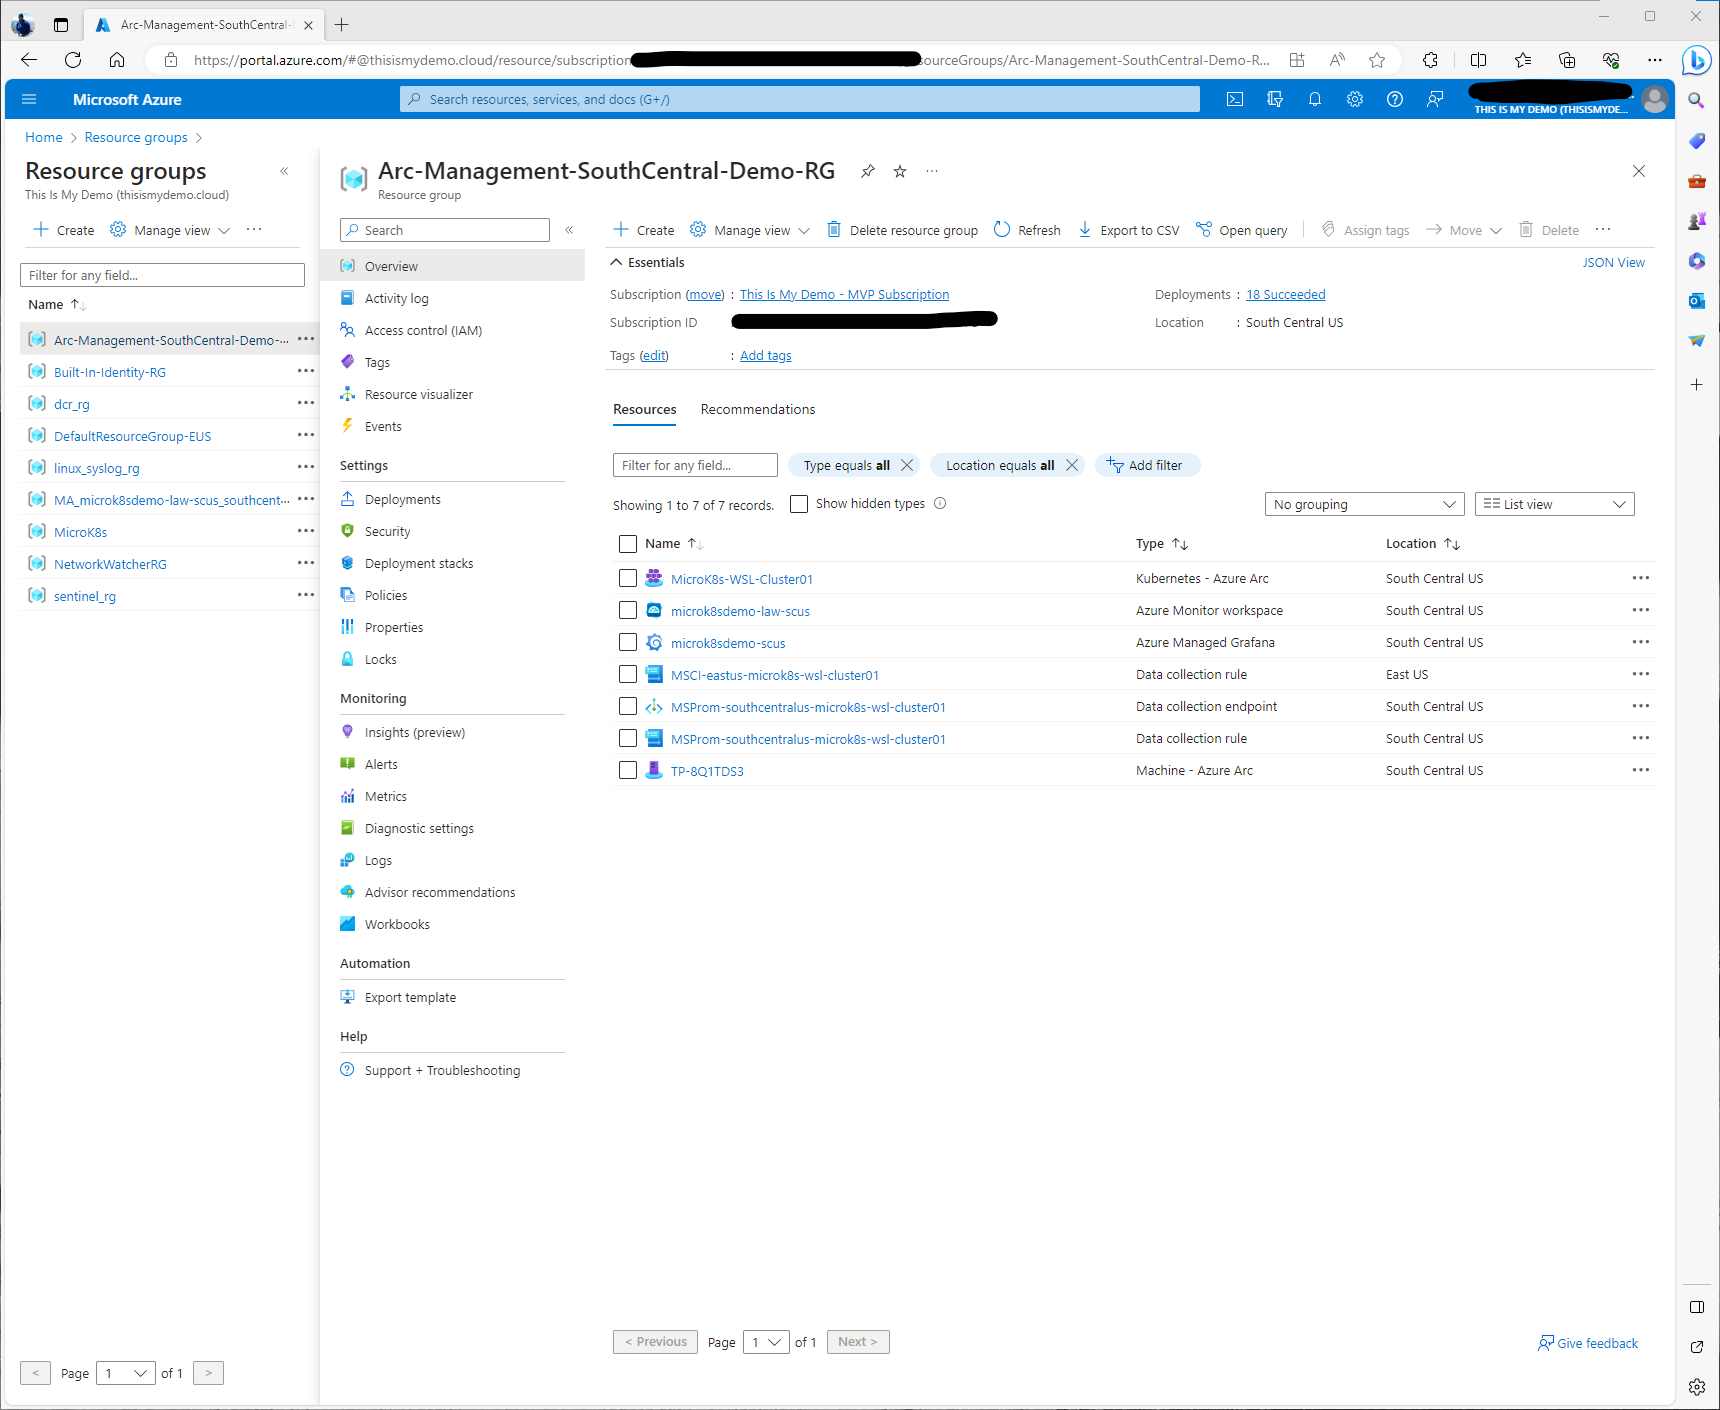
If I go back to my resource group, I will now see the Azure Monitor workspace resource, the Azure Managed Grafana Resource, and the data collection rule and endpoint for the managed prometheus instance.
Now What???
So now it looks like I have successfully enabled Container Insights, Prometheus, and Grafana. So let’s do a high level overview of these services and the information we can get from them.
Container Insights
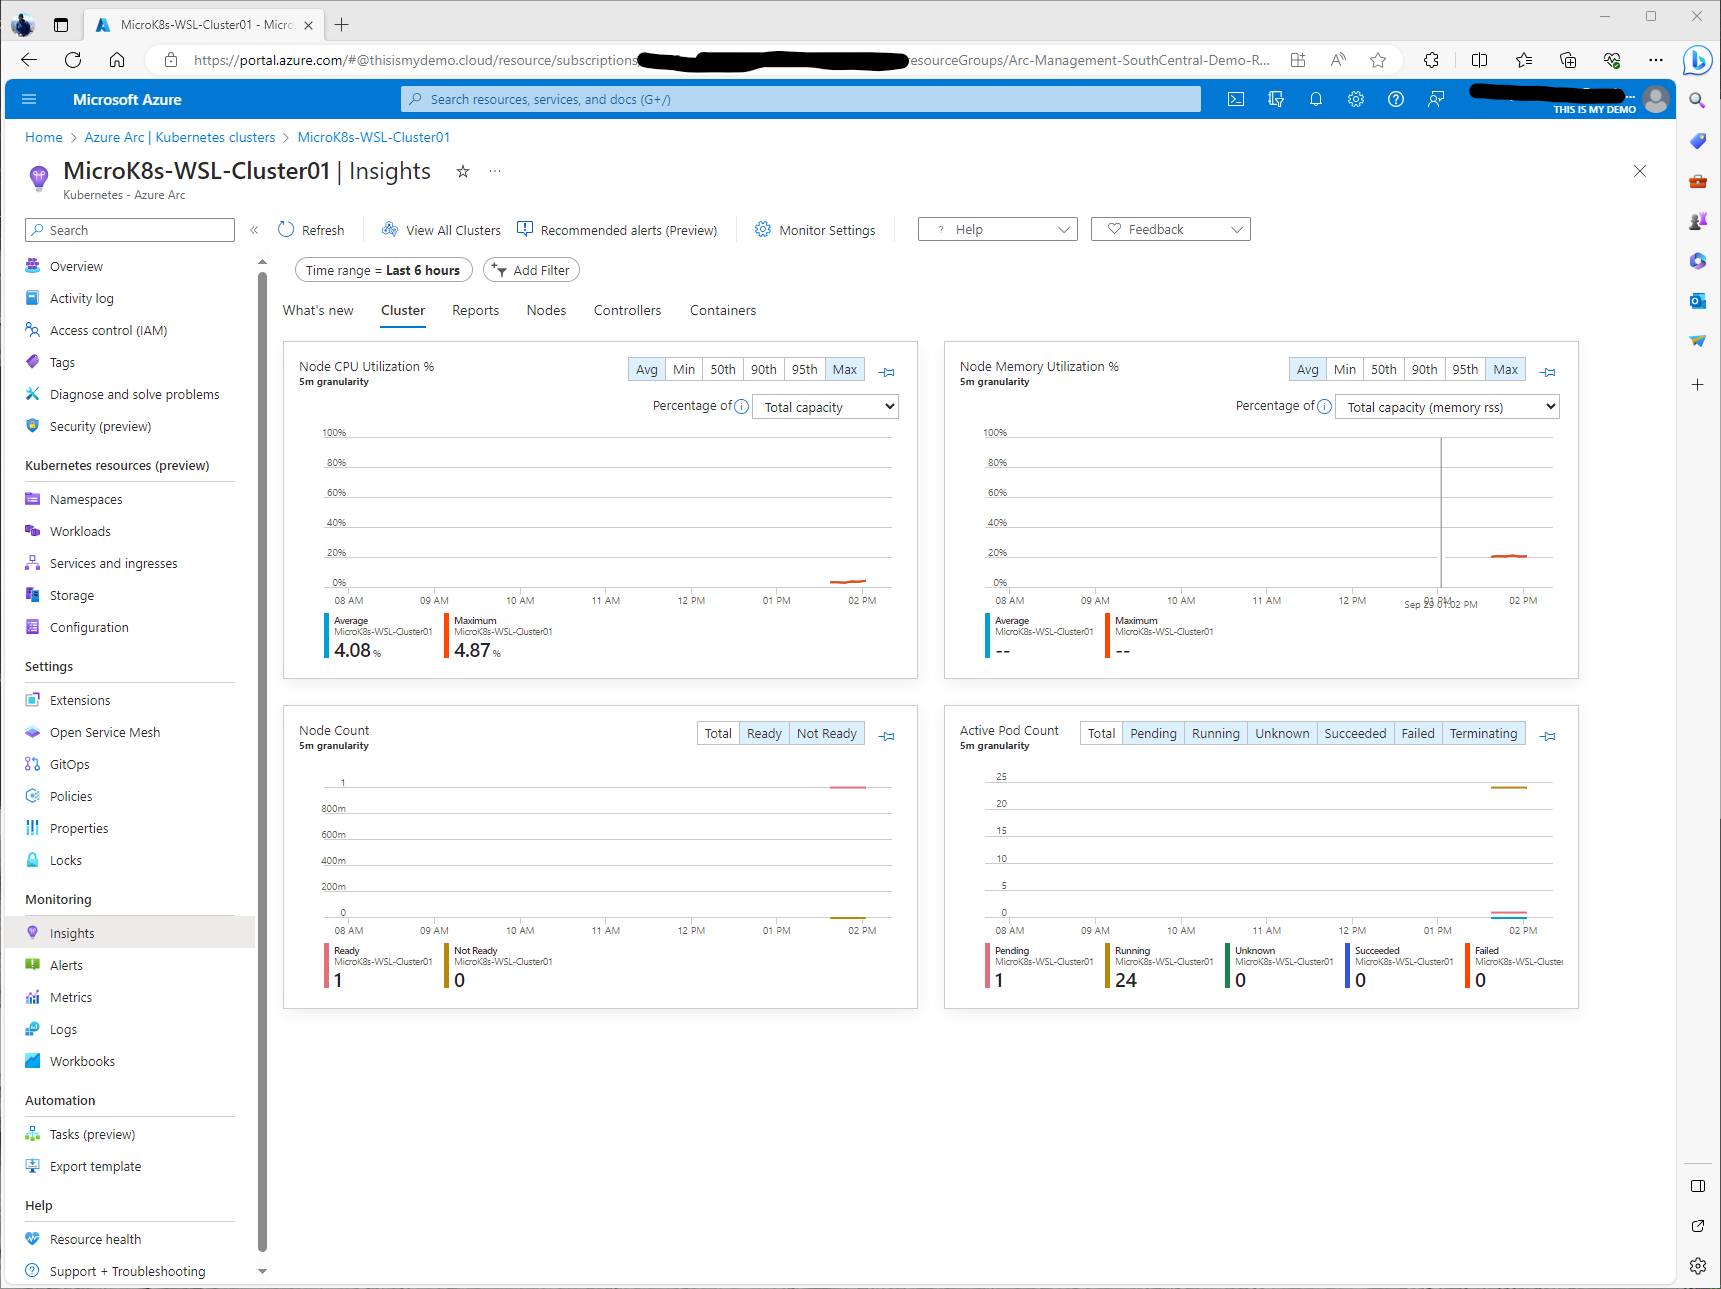
So from our Azure Arc-enabled Kubernetes cluster resource in the portal we can click Insights under Monitoring again. Here we will see the main Insights window that defaults to a Cluster level view of our MicroK8s cluster. On this window we can click Monitor settings at the top to change some of the data collection settings and a few other things. We can also click on Vew All Clusters and go back to a list of all monitored or unmonitored Kubernetes clusters. This can be Azure Kubernetes Clusters (AKS), to Google Cloud clusters and Amazon EKS clusters, to Open Shift clusters, and more. Any supported Kubernetes clusters that is either AKS or a cluster that is managed by Azure Arc-enabled Kubernetes will show up in the unmonitored section if we don’t have Insights enabled yet on them yet. We have Time range which we can adjust the time range of the data from the last 6 hours to the last 24 hours, etc. We can also add filters as well.
Just above the graphs, we see our menu of items we can select to dig deeper into various parts of our cluster. We have Reports, Nodes, COntrollers and Containers.
If I click Reports, this will bring me to a list of Azure Monitor Workbooks that are available.
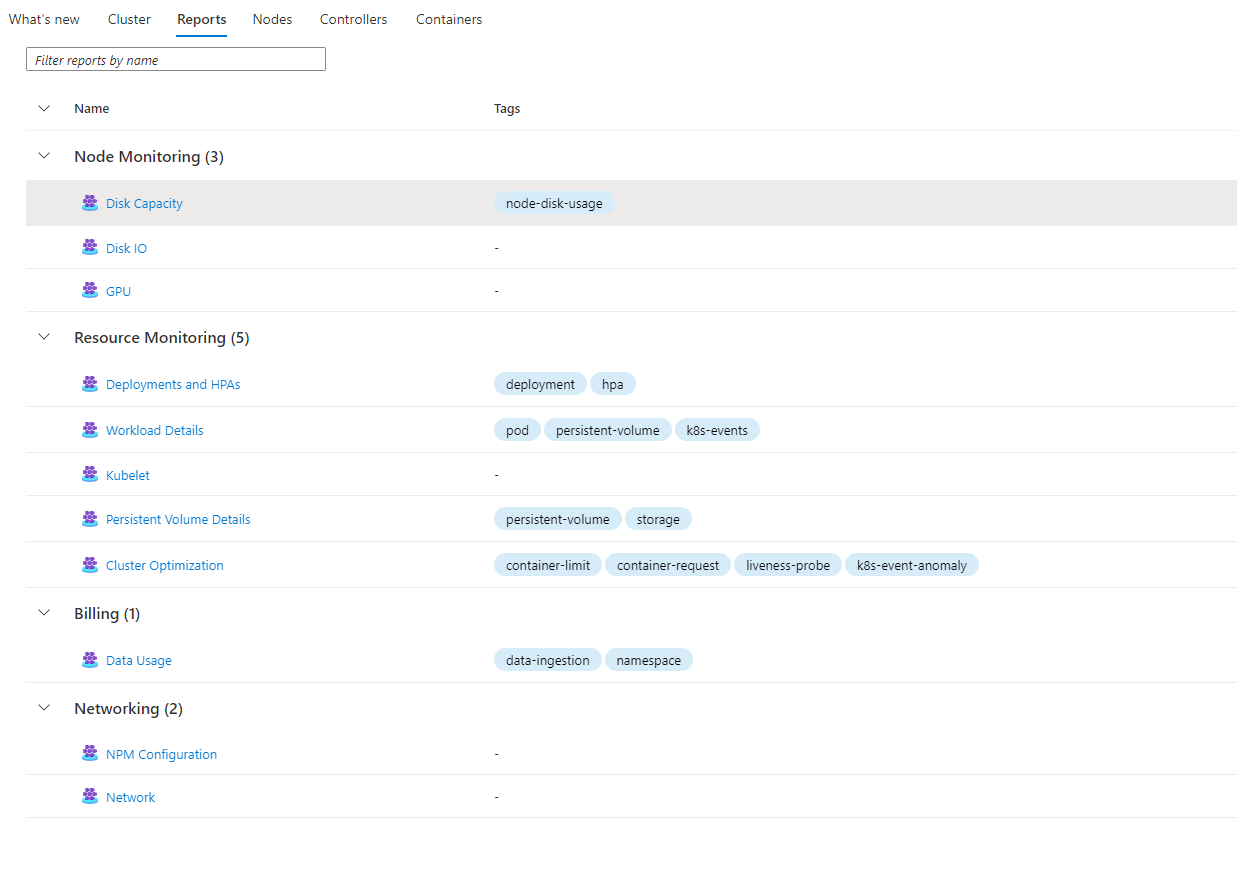
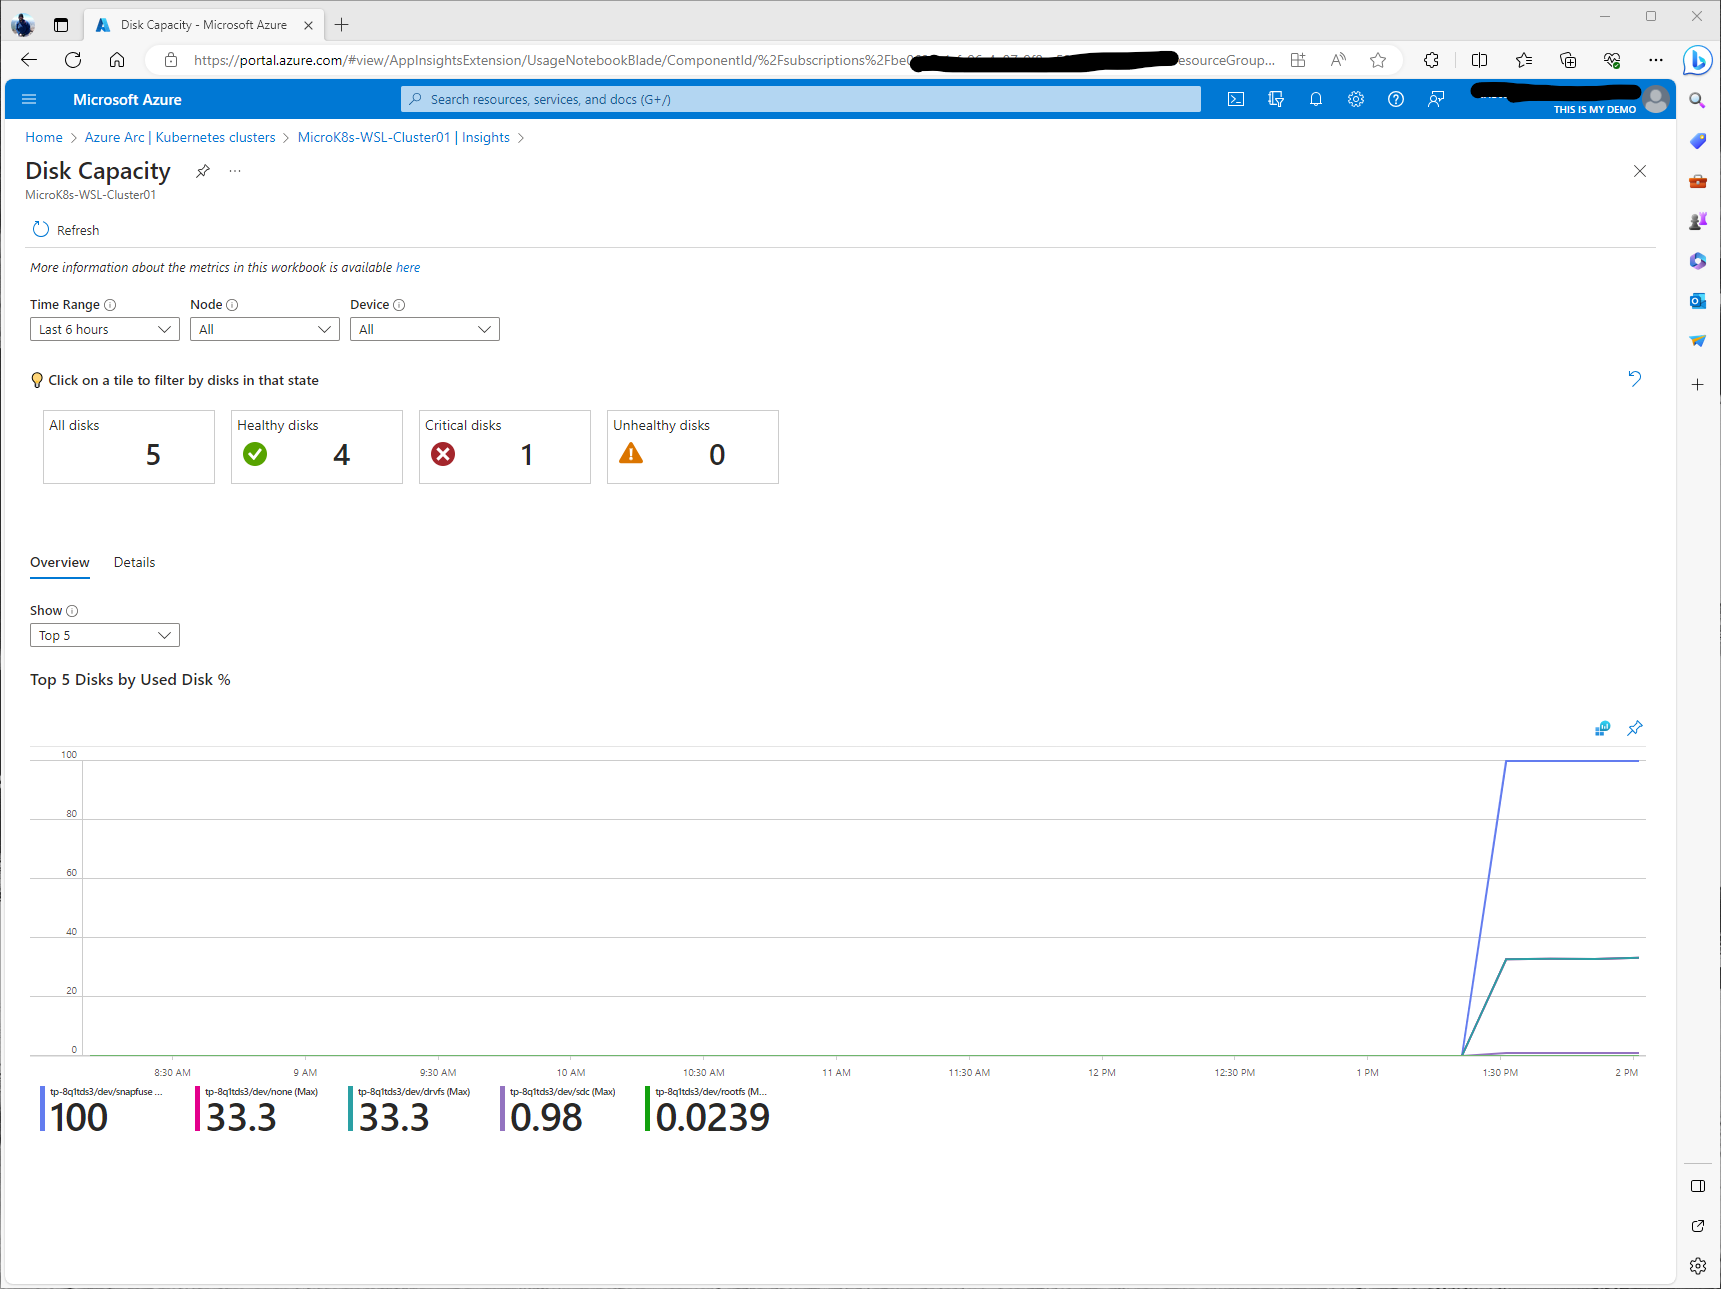
We can click one of those links, for instance the Disk Capacity report and the Azure Monitor Workbook will open. Azure Monitor Workbooks are very powerful and very customizable. If you haven’t used them or even heard of them I highly recommend you check them out.
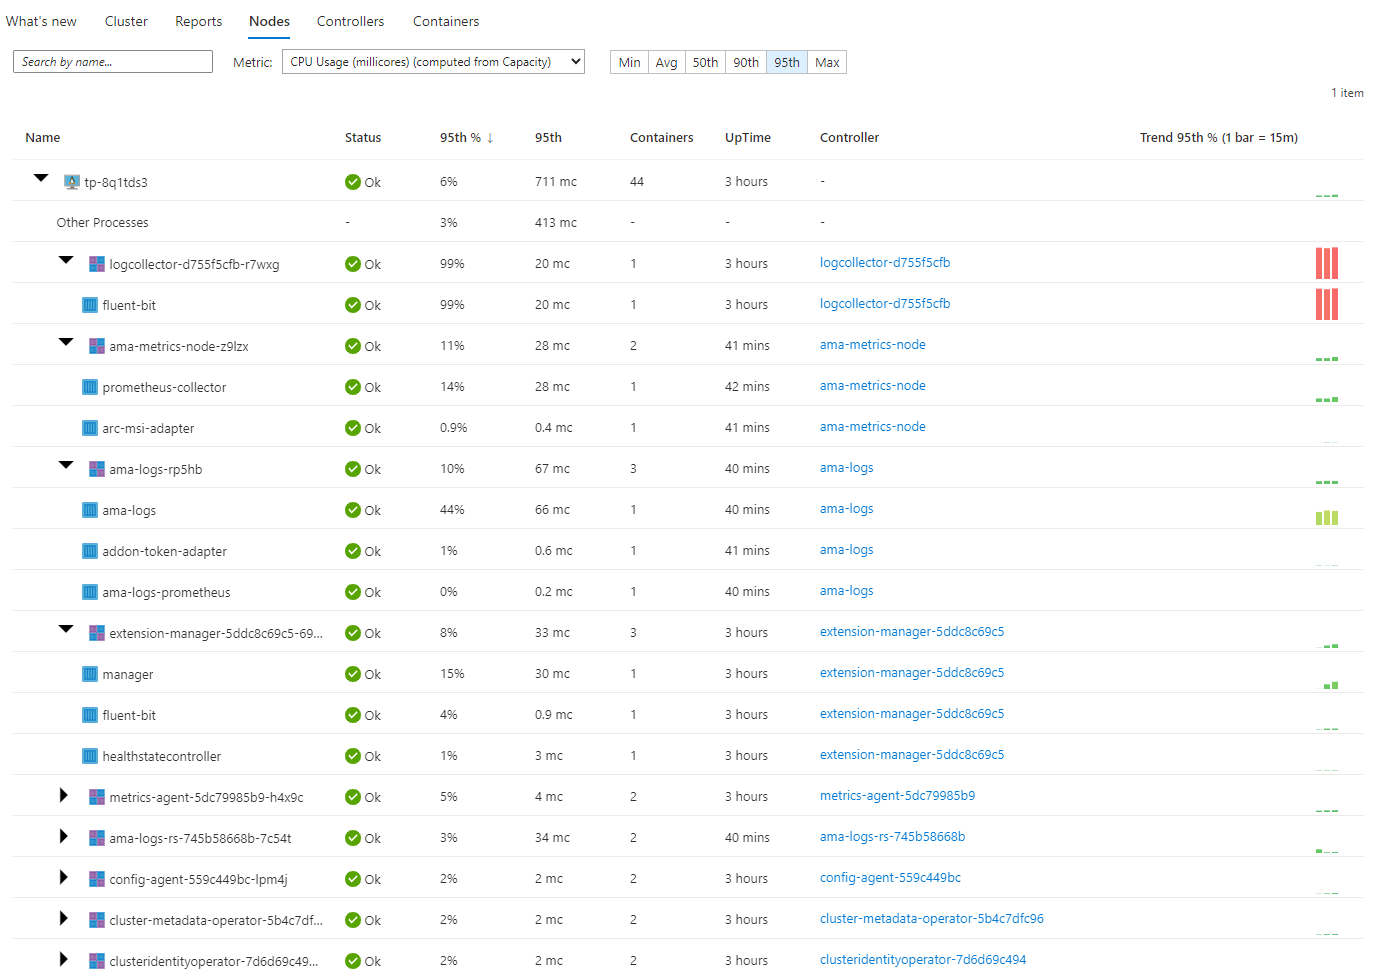
The Nodes menu gives us a deeper look into our Nodes. Here we can see processes that are running, the status of those processes, which controller those processes belong to, update information, and how many containers are associated with those processes. There is a Metric drop down window that allows us to get metrics from CPU Usage, Memory and more.
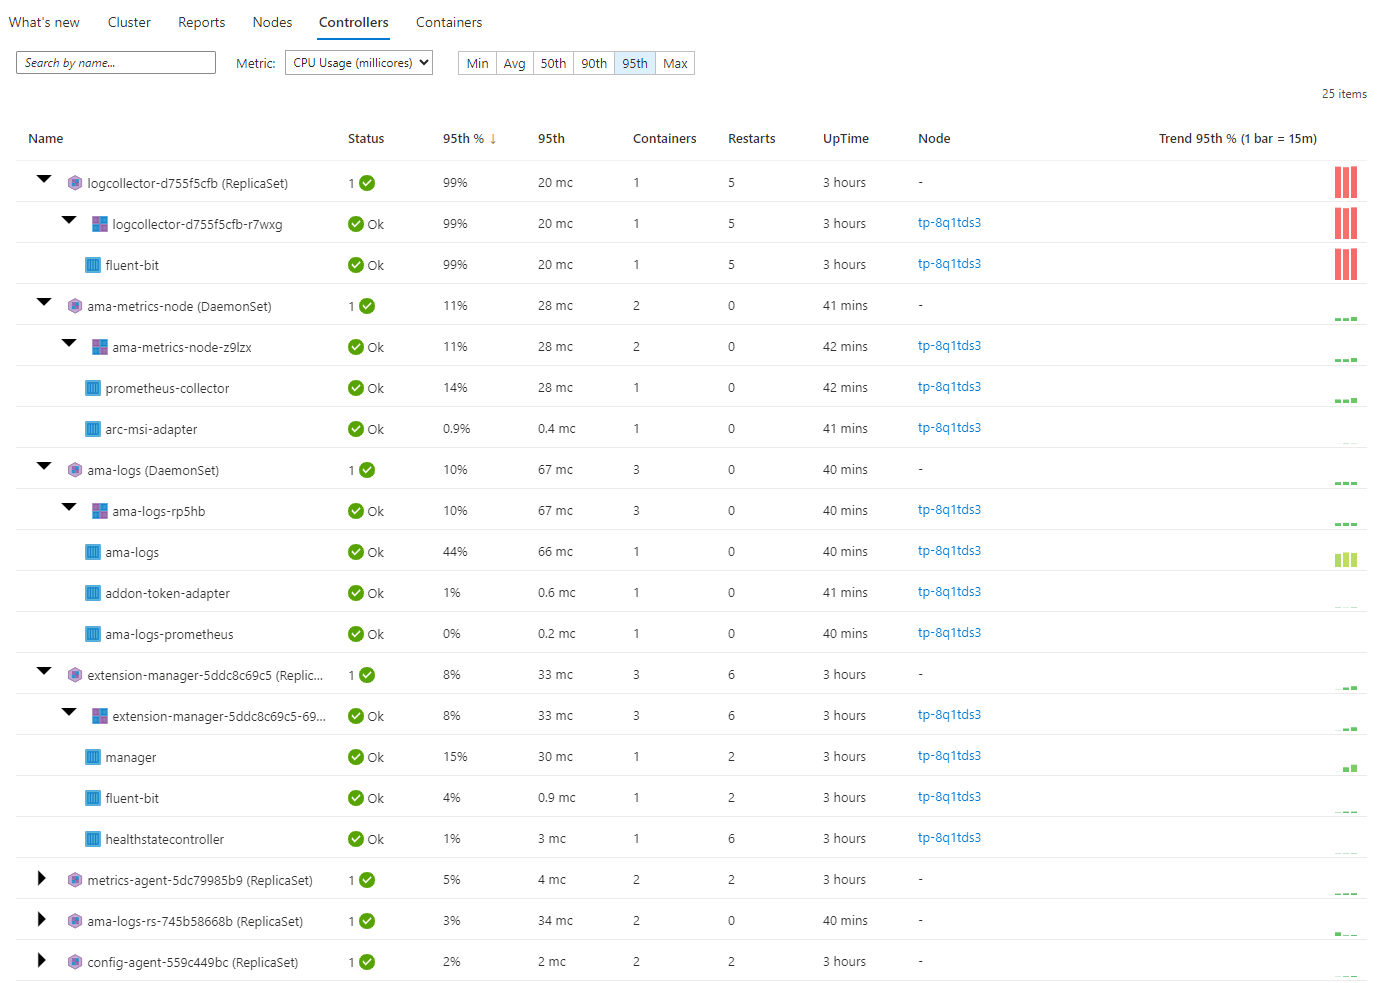
The Controllers menu will give you a deeper dive into your controllers running on the cluster. You can see the processes and the processes and the containers that run under each controller if you expand each controller. You will also get quick access to information about uptime, which node these are running on, how many containers are running and how many restarts for each container.
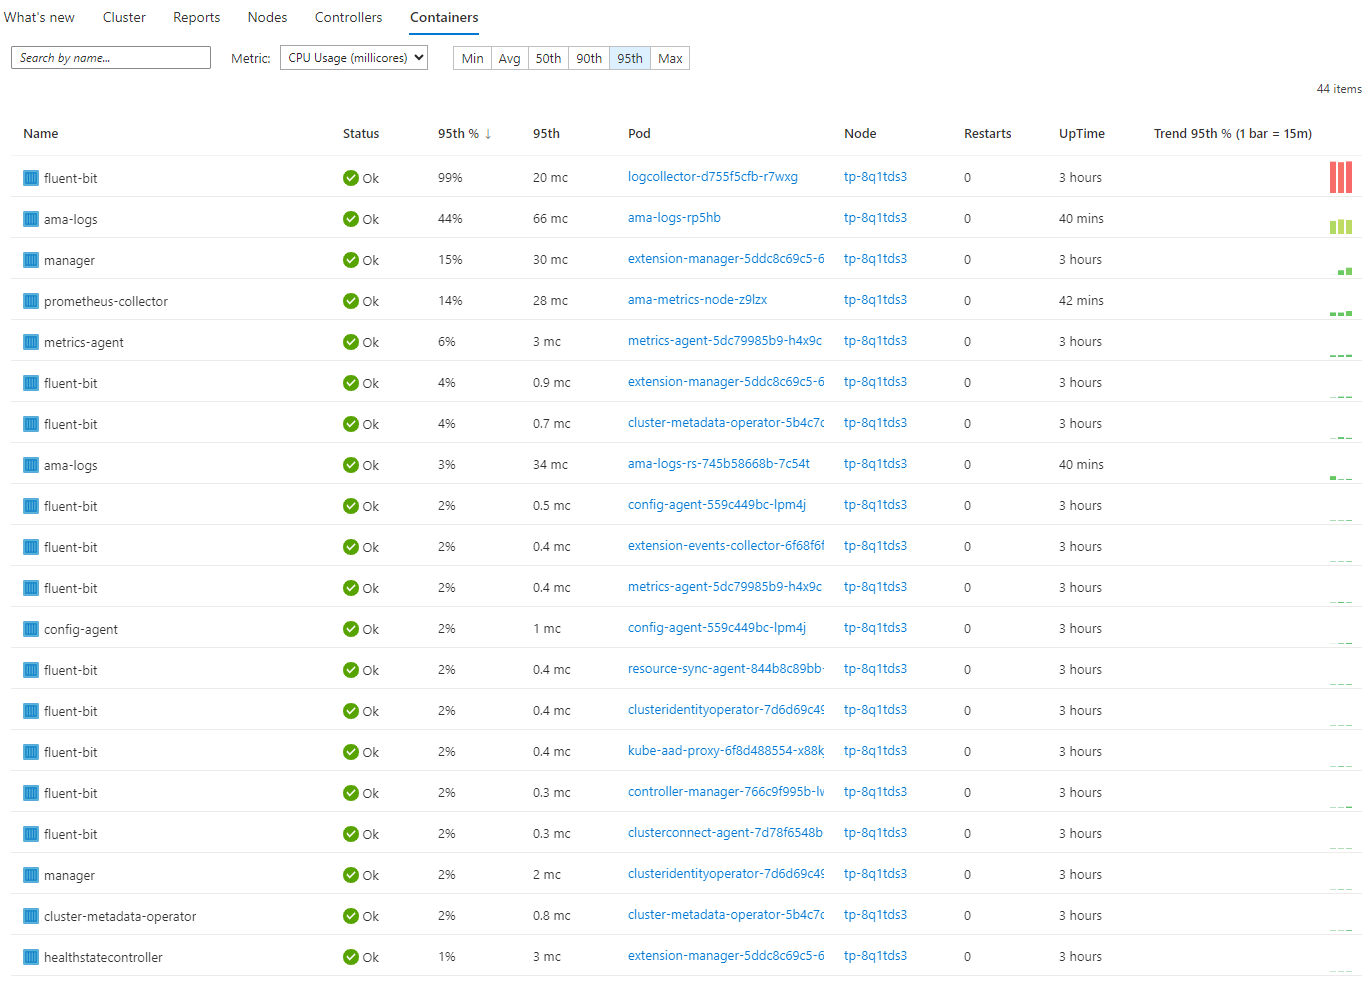
The final menu is Containers. This gives us insights into each container and what pods are in these containers that are running on our cluster. It will again give us uptime for each pod/container, which node these containers are on, etc.
If we click on one of the containers, an overview window will open giving us more information about that container, the container image, and more.
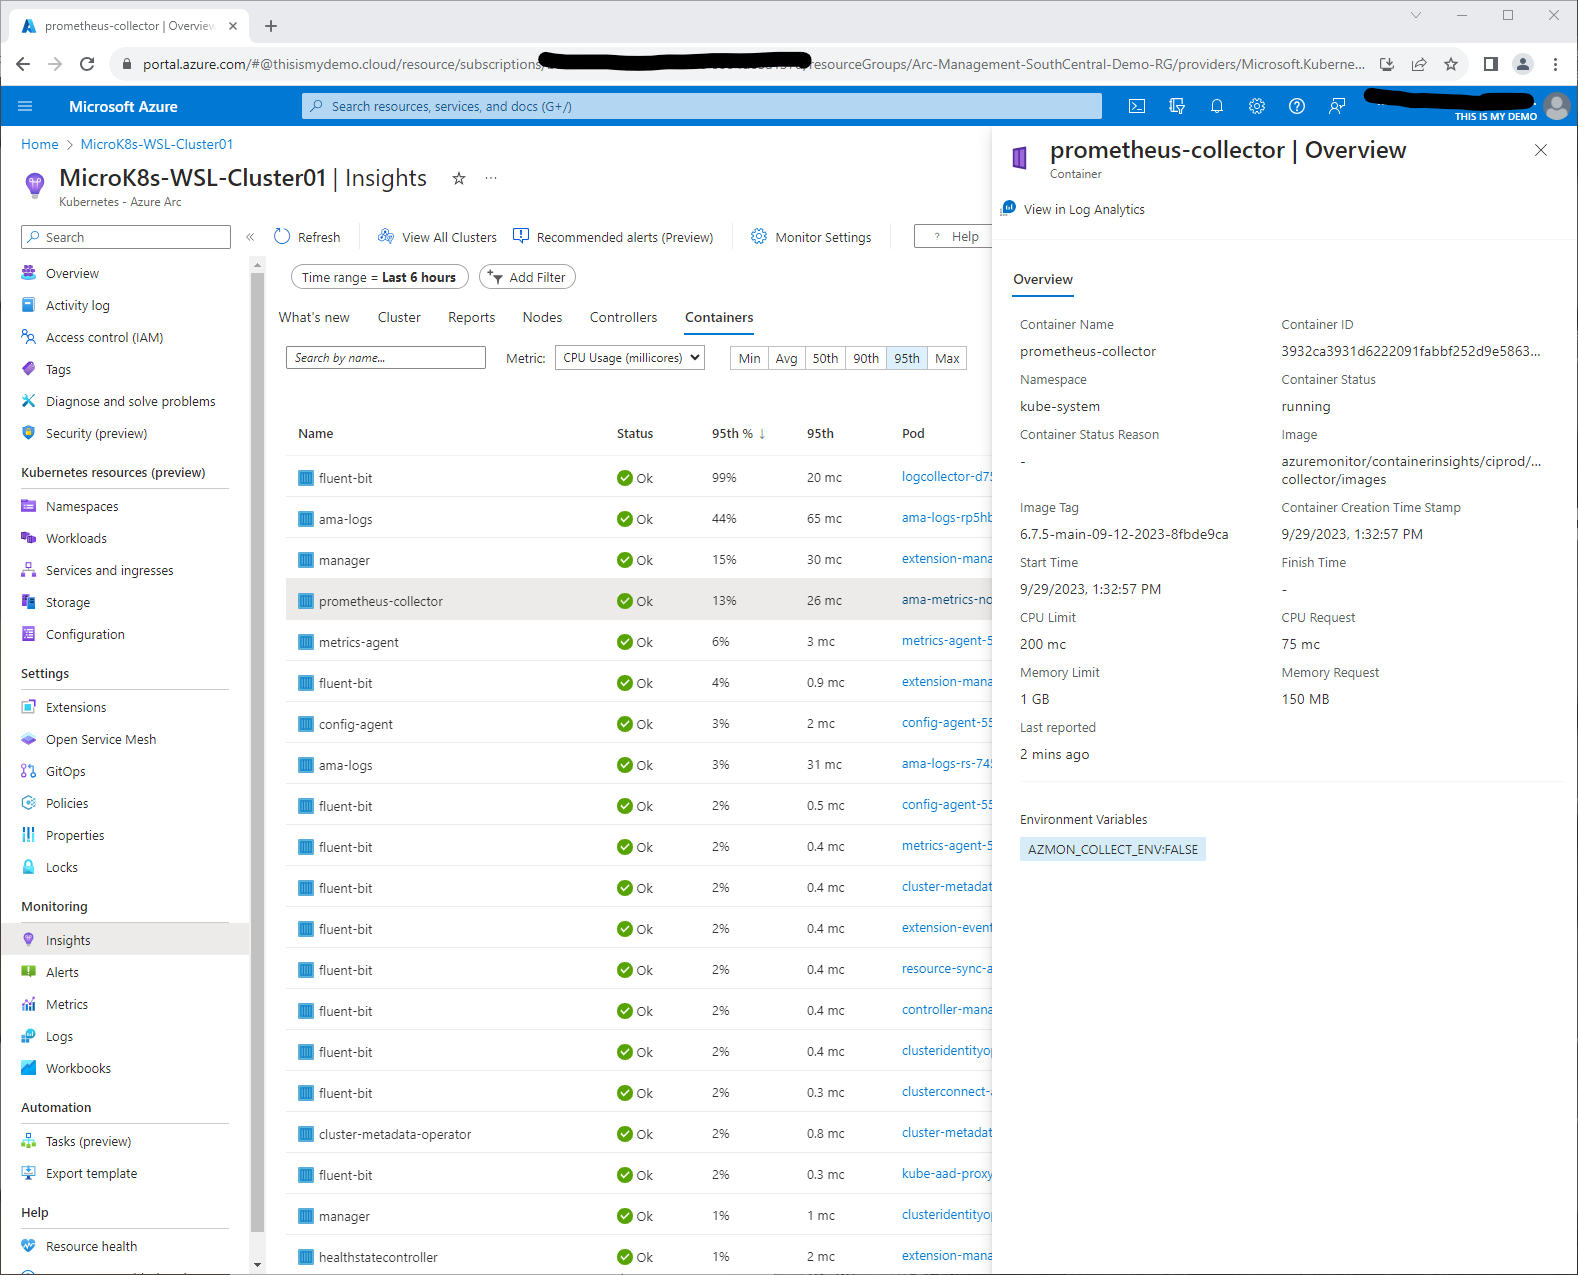
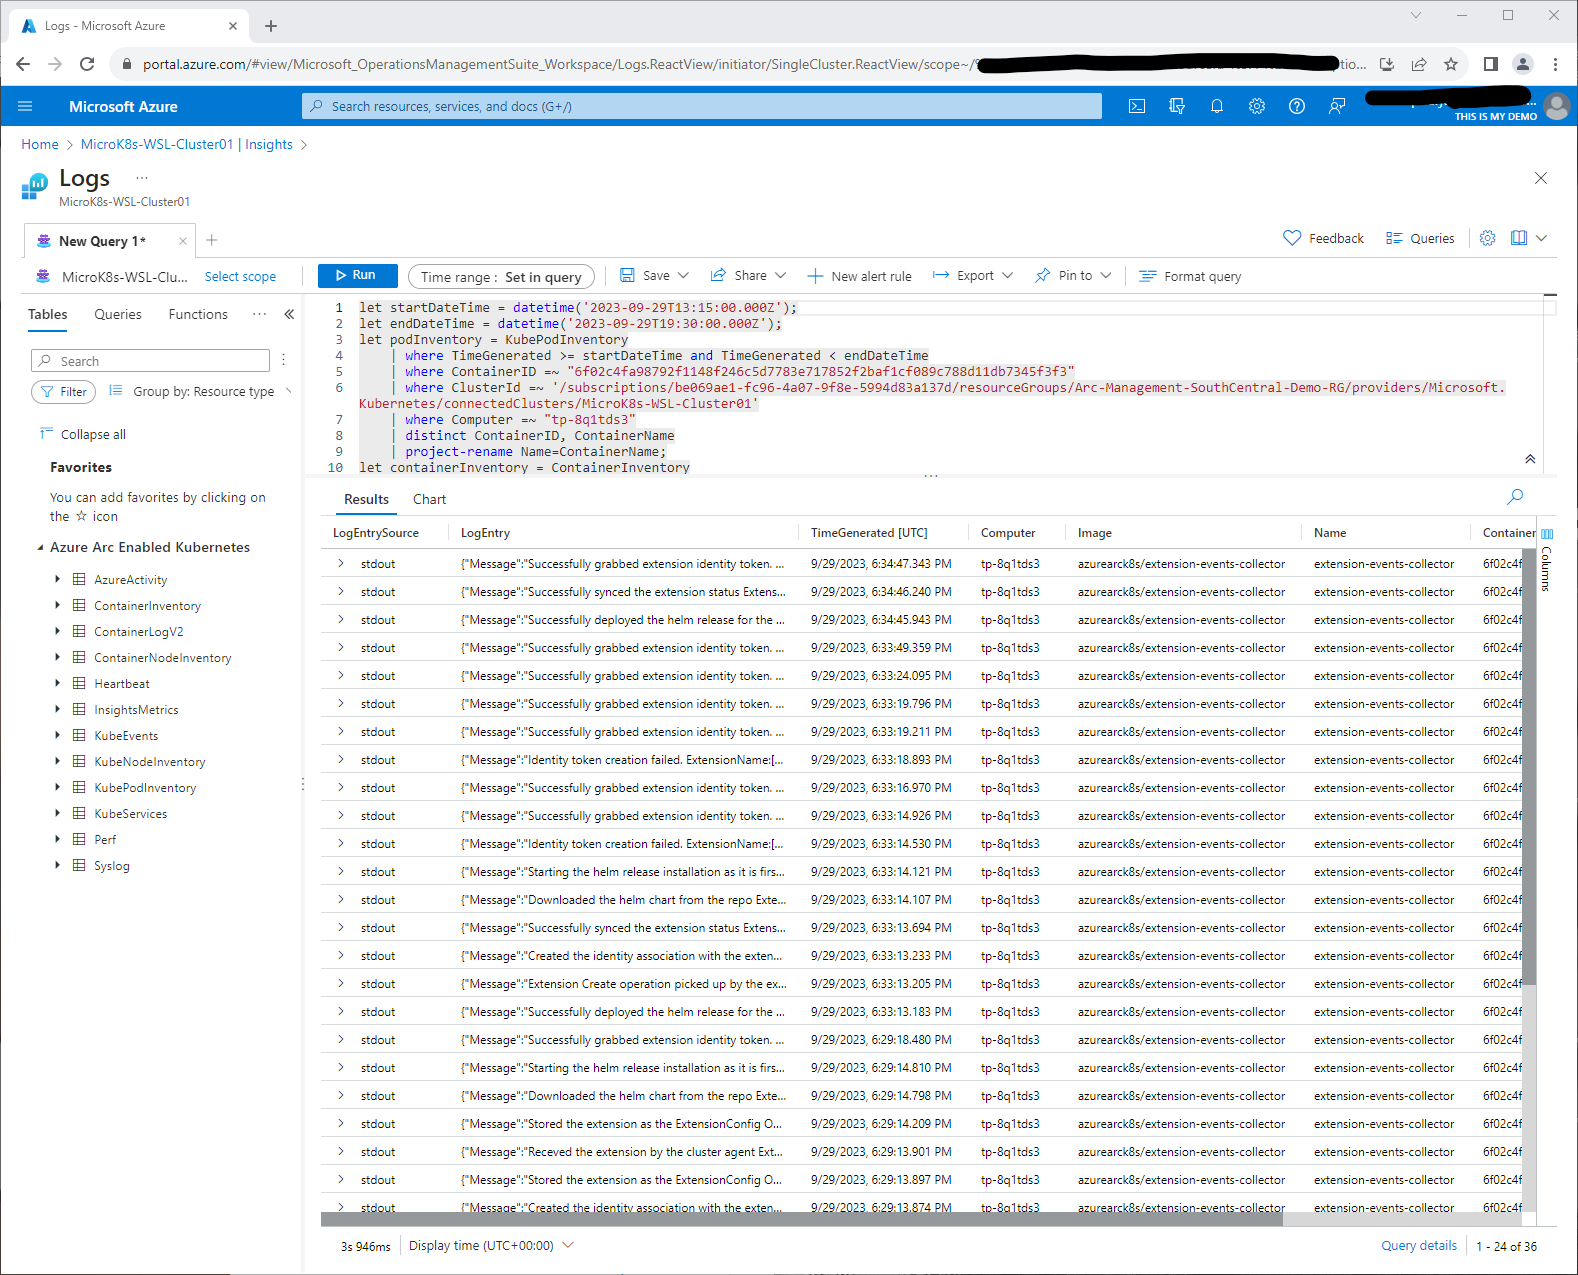
If we click on the View in Log Analytics button it will open Log Analytics and give us near real time data from that specific container.
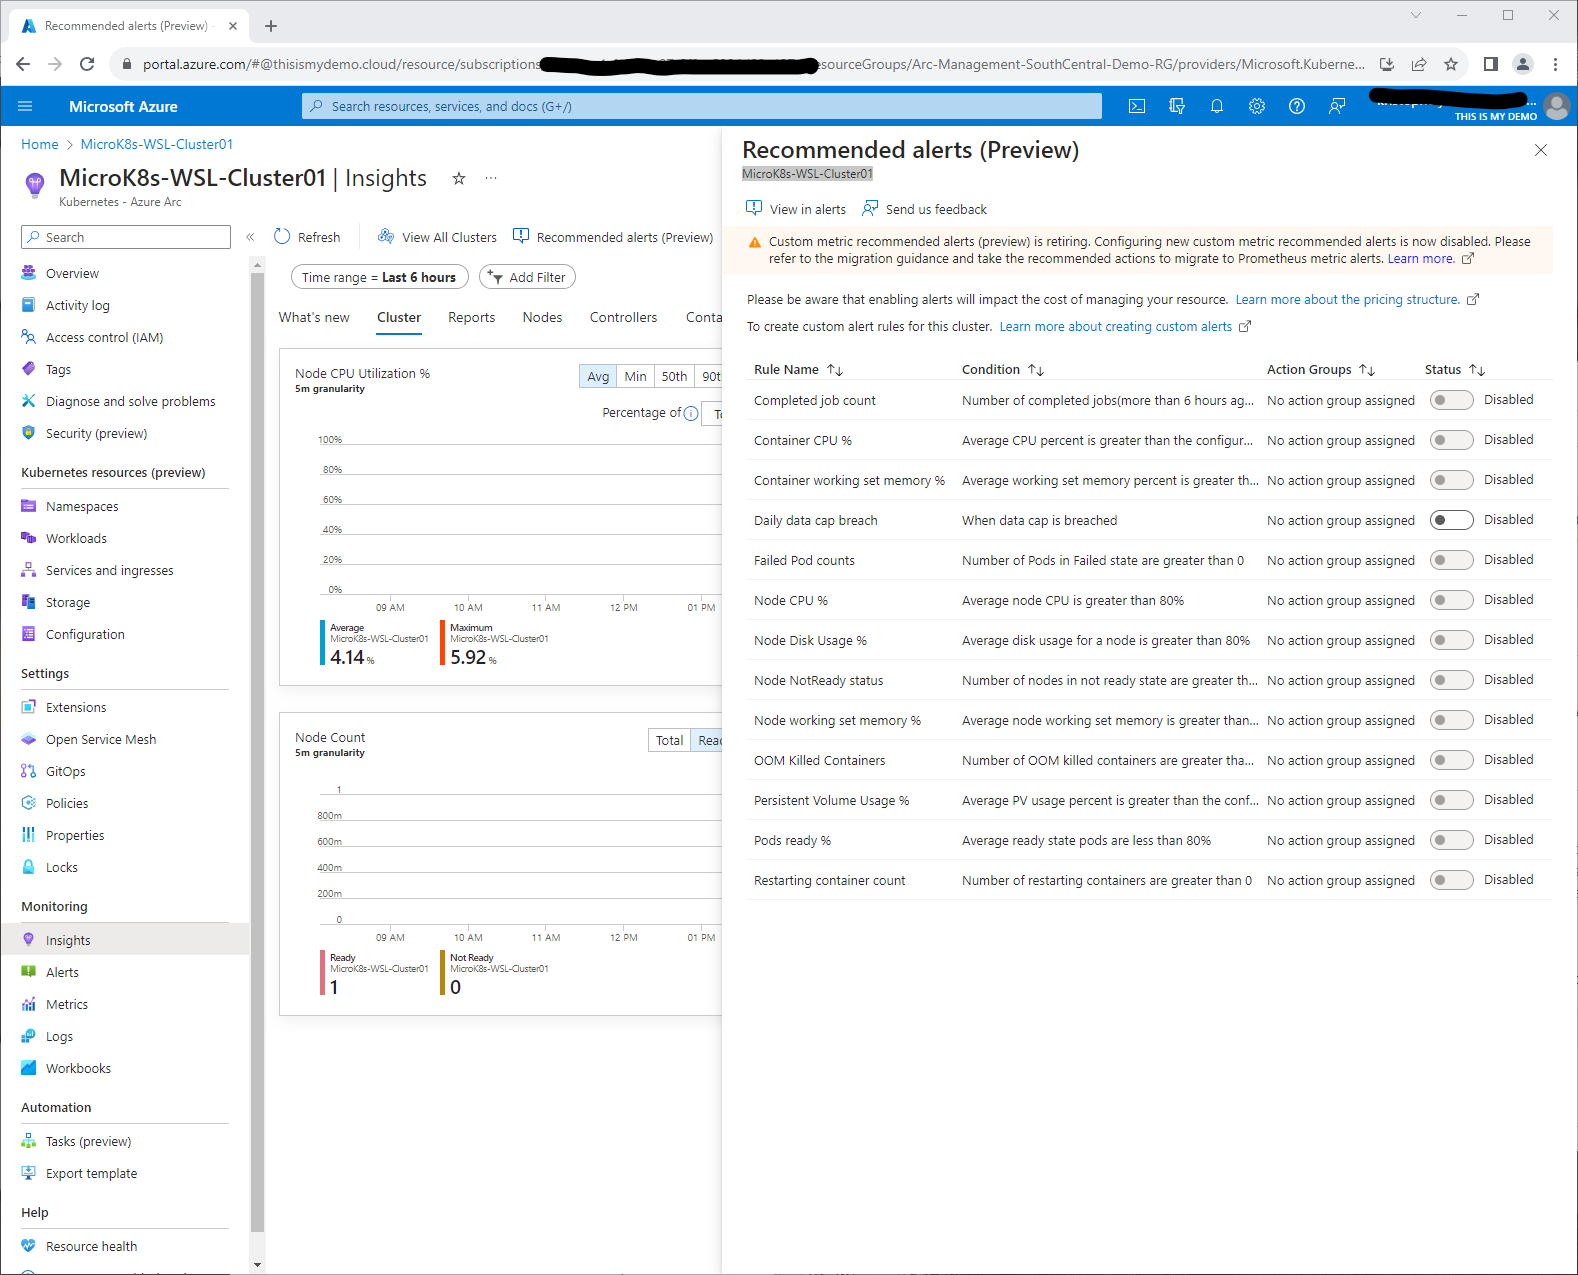
Now that is pretty much it for now for Azure Monitor Container Insights. The one other thing I would enable are some of the Recommended alerts which are still in Preview but may come in handy. To do so, you can click on the Recommended Alerts (Preview) button at the top of the Insights blade.
Grafana and Prometheus
I will be honest here. I do not know much about Prometheus or Grafana. I have used Grafana for dashboards in the past and use it for a dashboard for my Home Assistant server. Outside of that I don’t have really a clue. I know enough with Managed Prometheus where to find it, what Azure Monitor Workspace it is associated with, and some other basics like how to pull data from it that may come in handy for some other services. I have just enough experience with Grafana that I will show a few dashboard views in this blog just to make sure that it was enabled and it is working correctly.
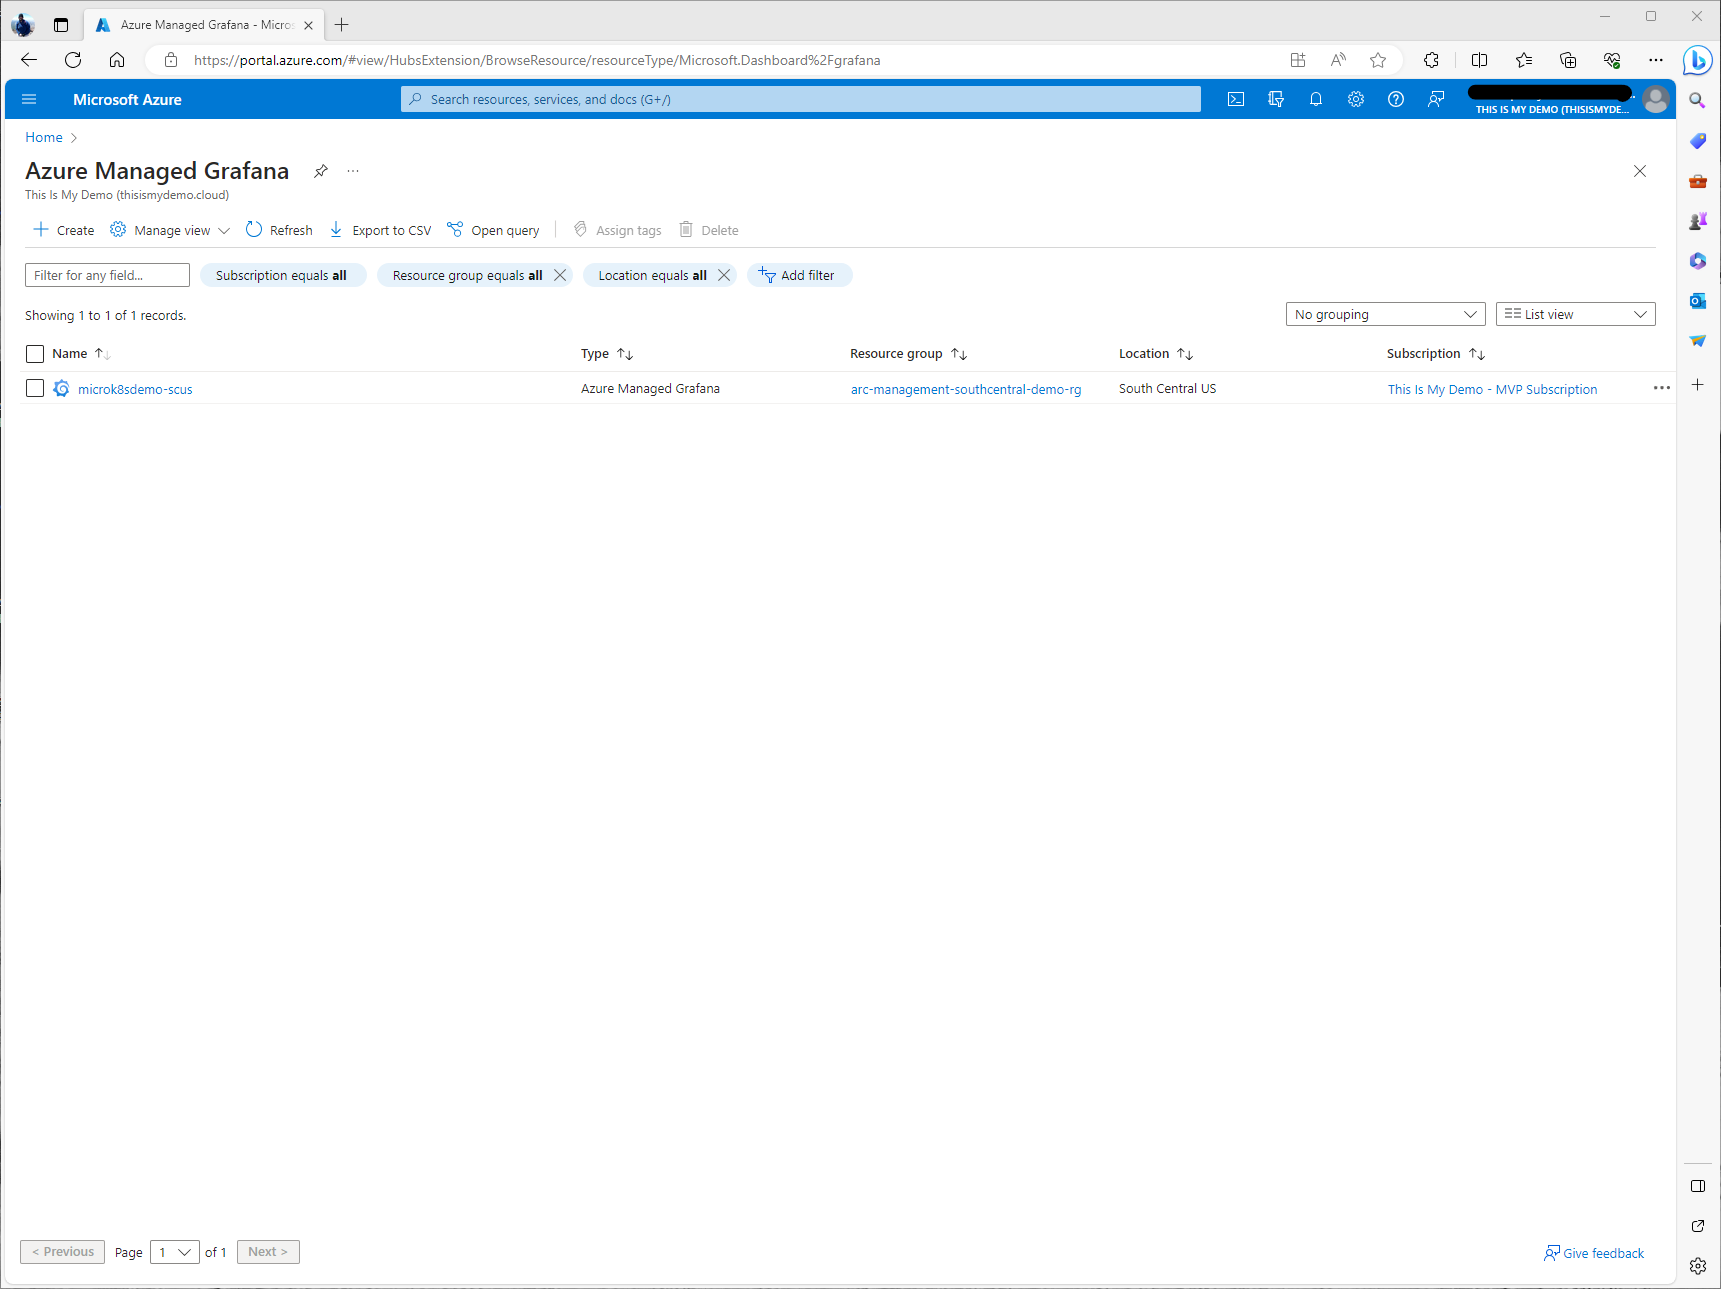
I will start by going to the Managed Grafana blade on the Azure Portal. Here I was able to see my newly created Grafana instance that was created earlier.
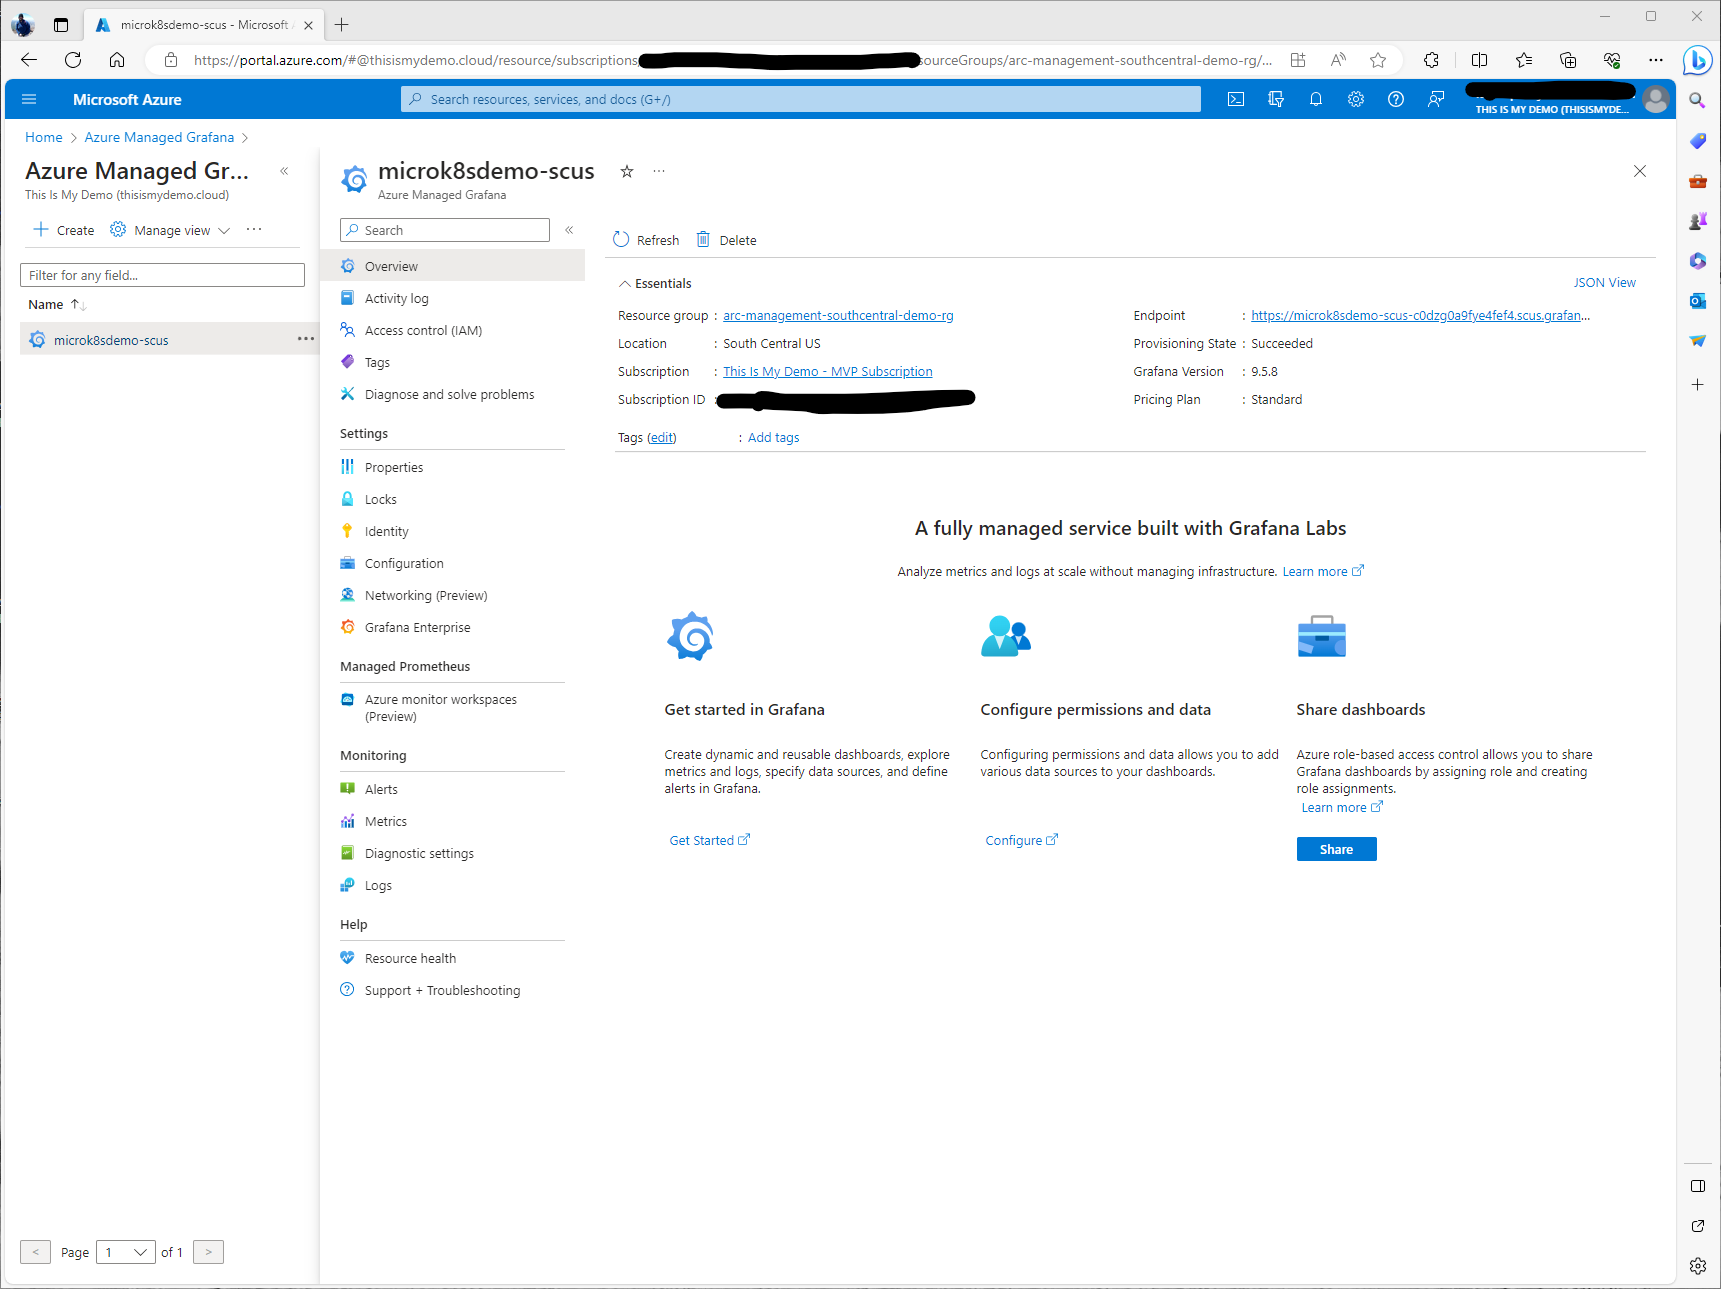
Once we click on our instance we will see the overview screen for that instance. Here we can see the endpoint for the Grafana Desktop.
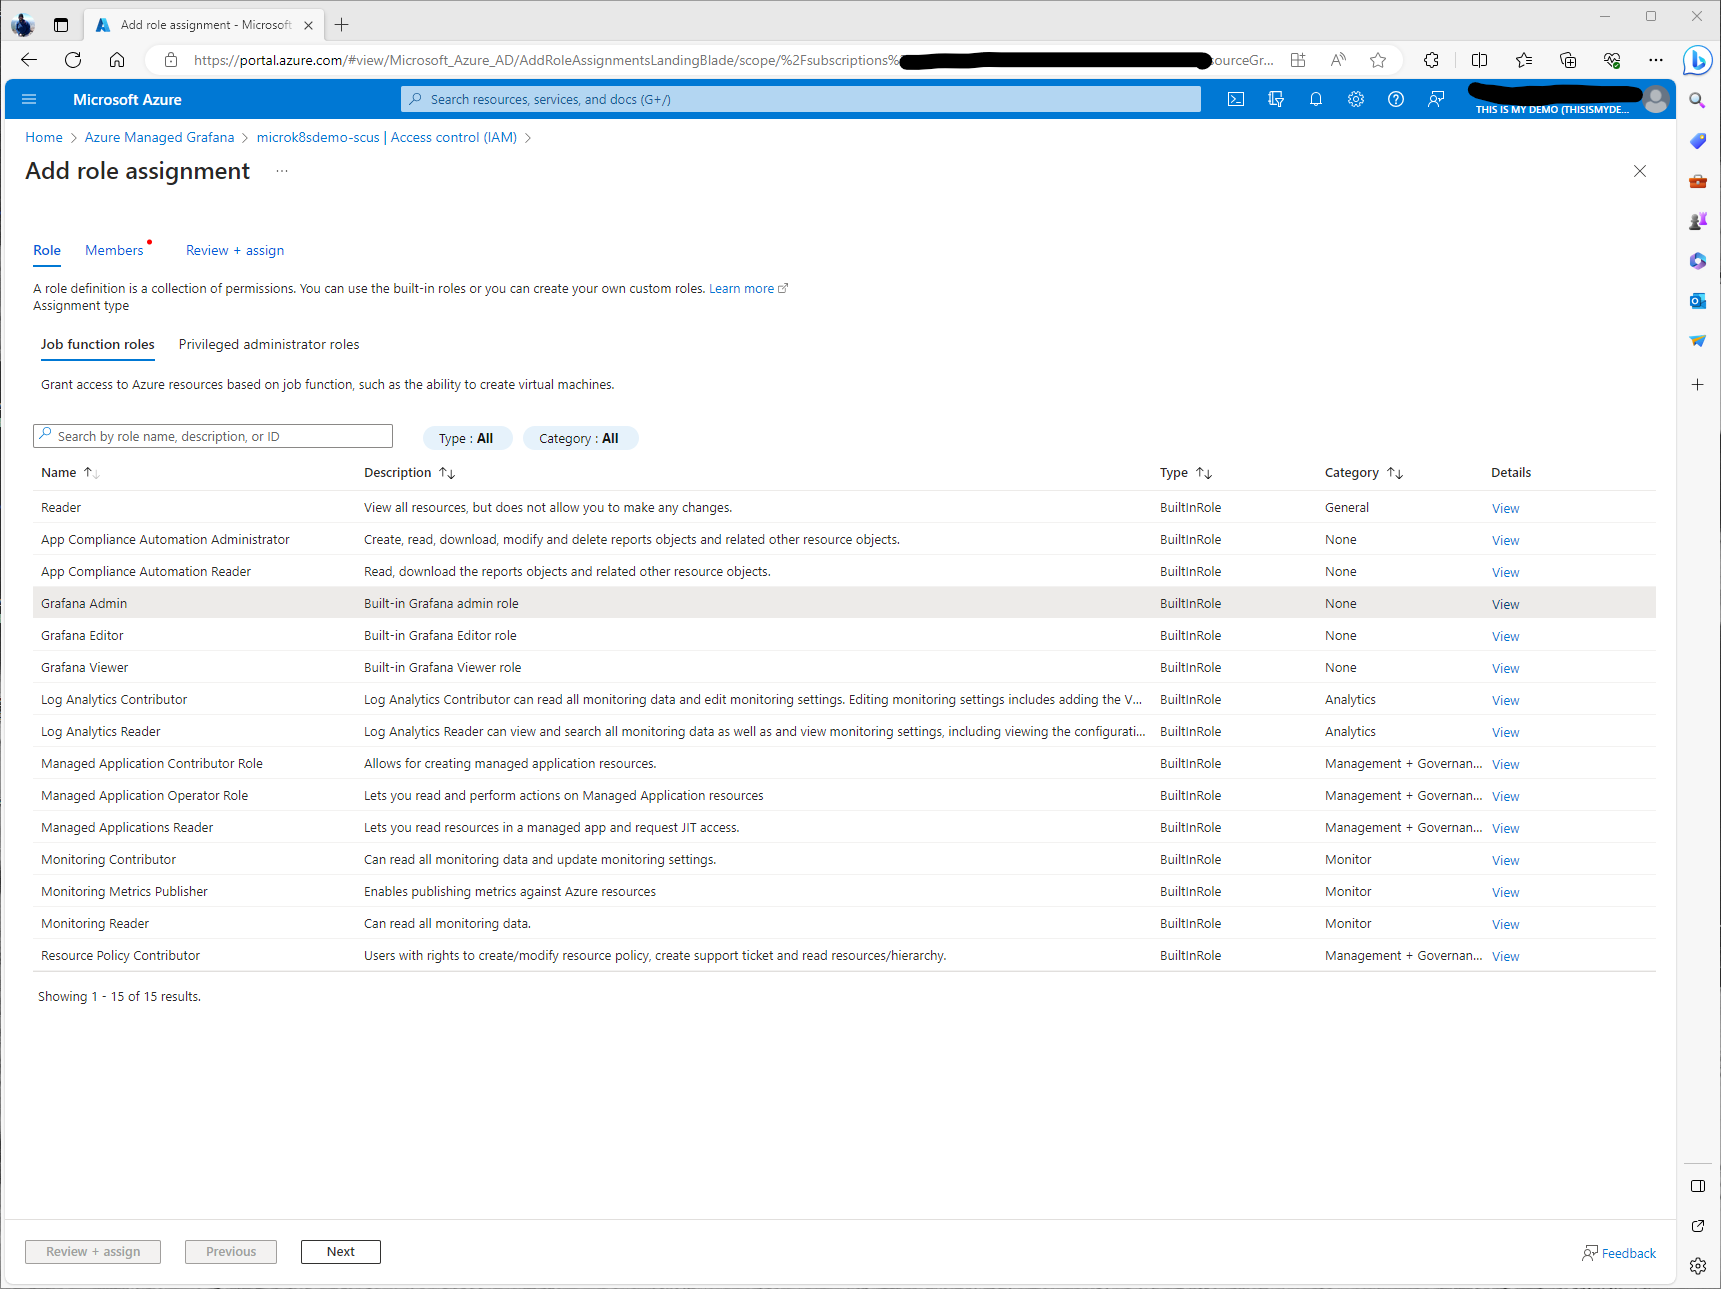
The one thing I did need to do was give rights to another user so they could access the dashboards. I did this by going to the Access Control (IAM) and giving one of my accounts rights. For my demo I just gave my demo users Grafana Admin roles. Normally I wouldn’t do this. Don’t do as I do.
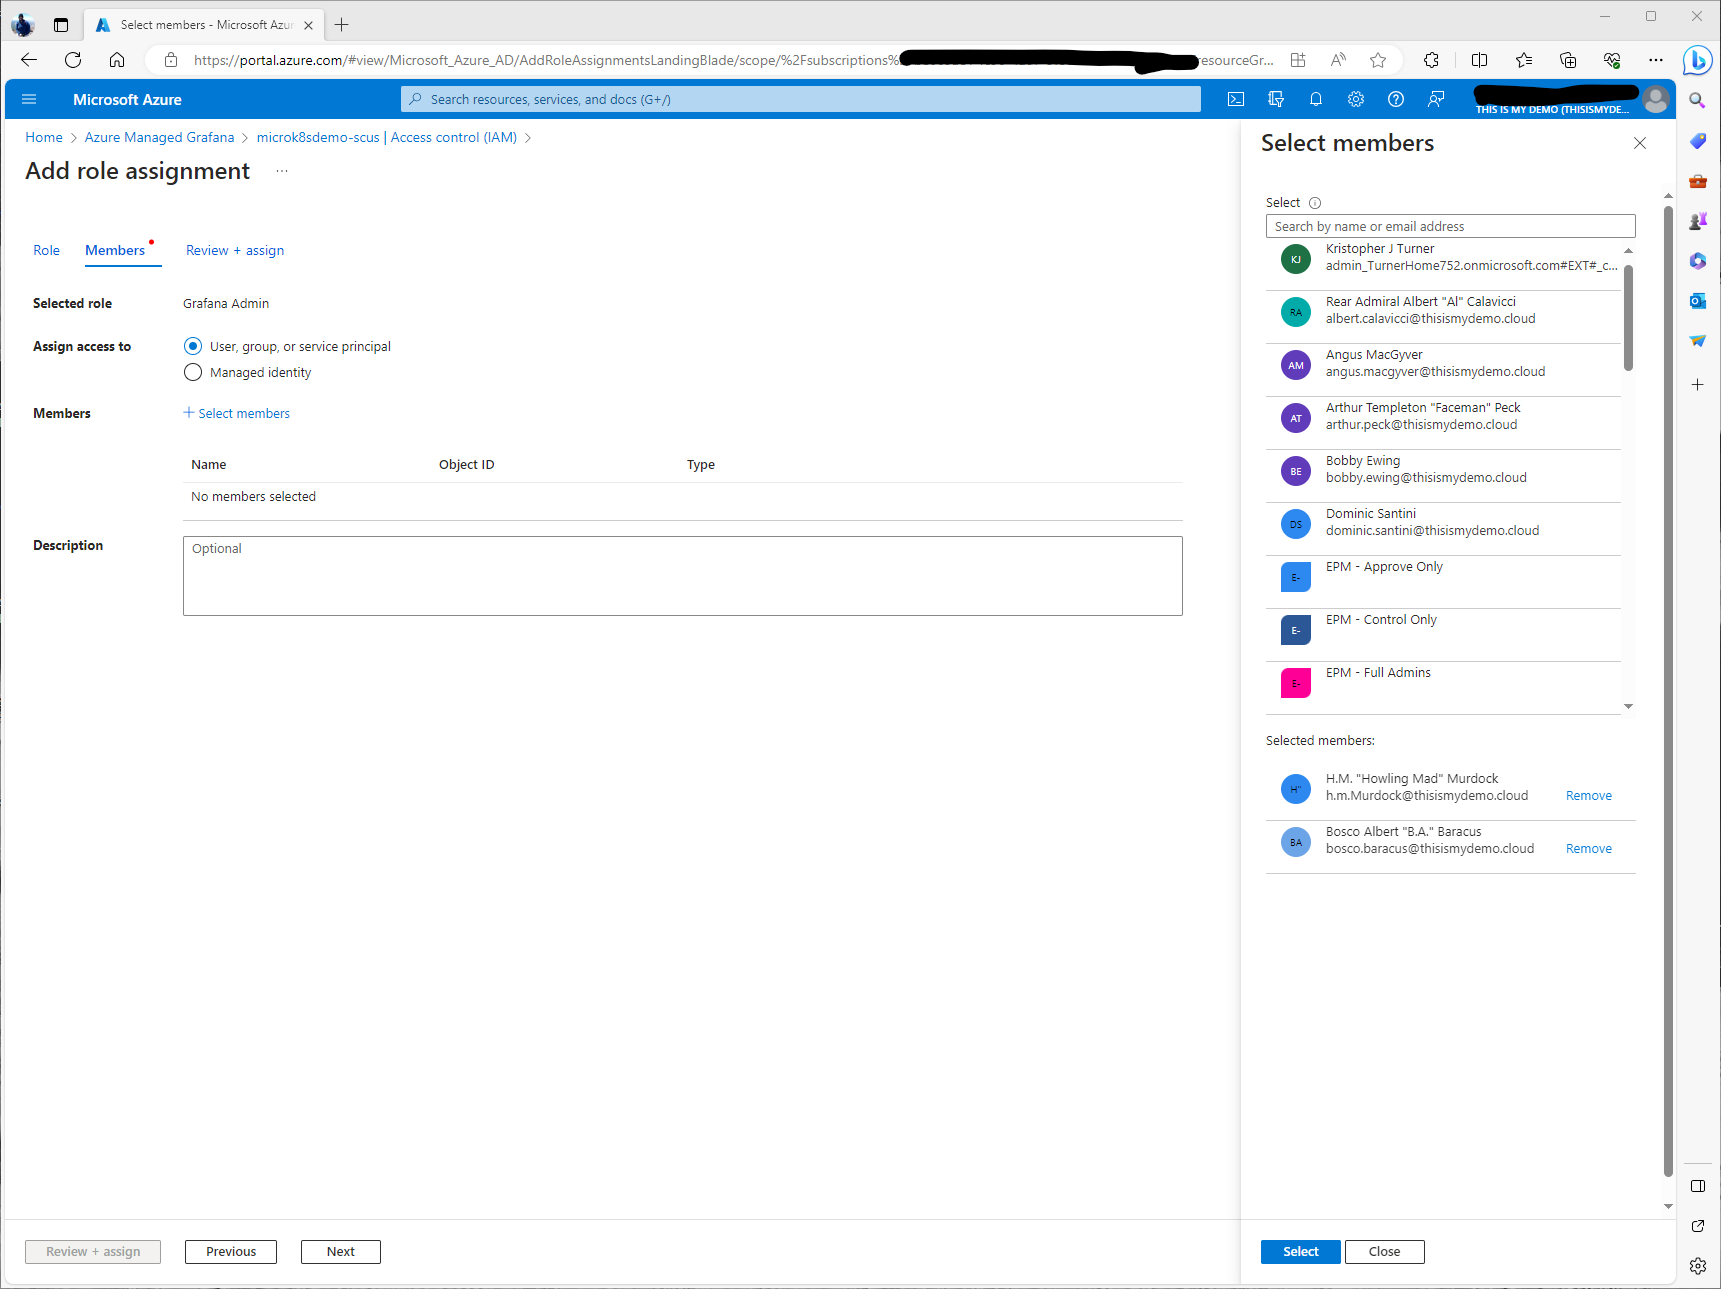
Next I selected a few users. I decided Mr. T and Murdoch were the two that needed Grafana Admin roles assigned so they can work on creating dashboards.
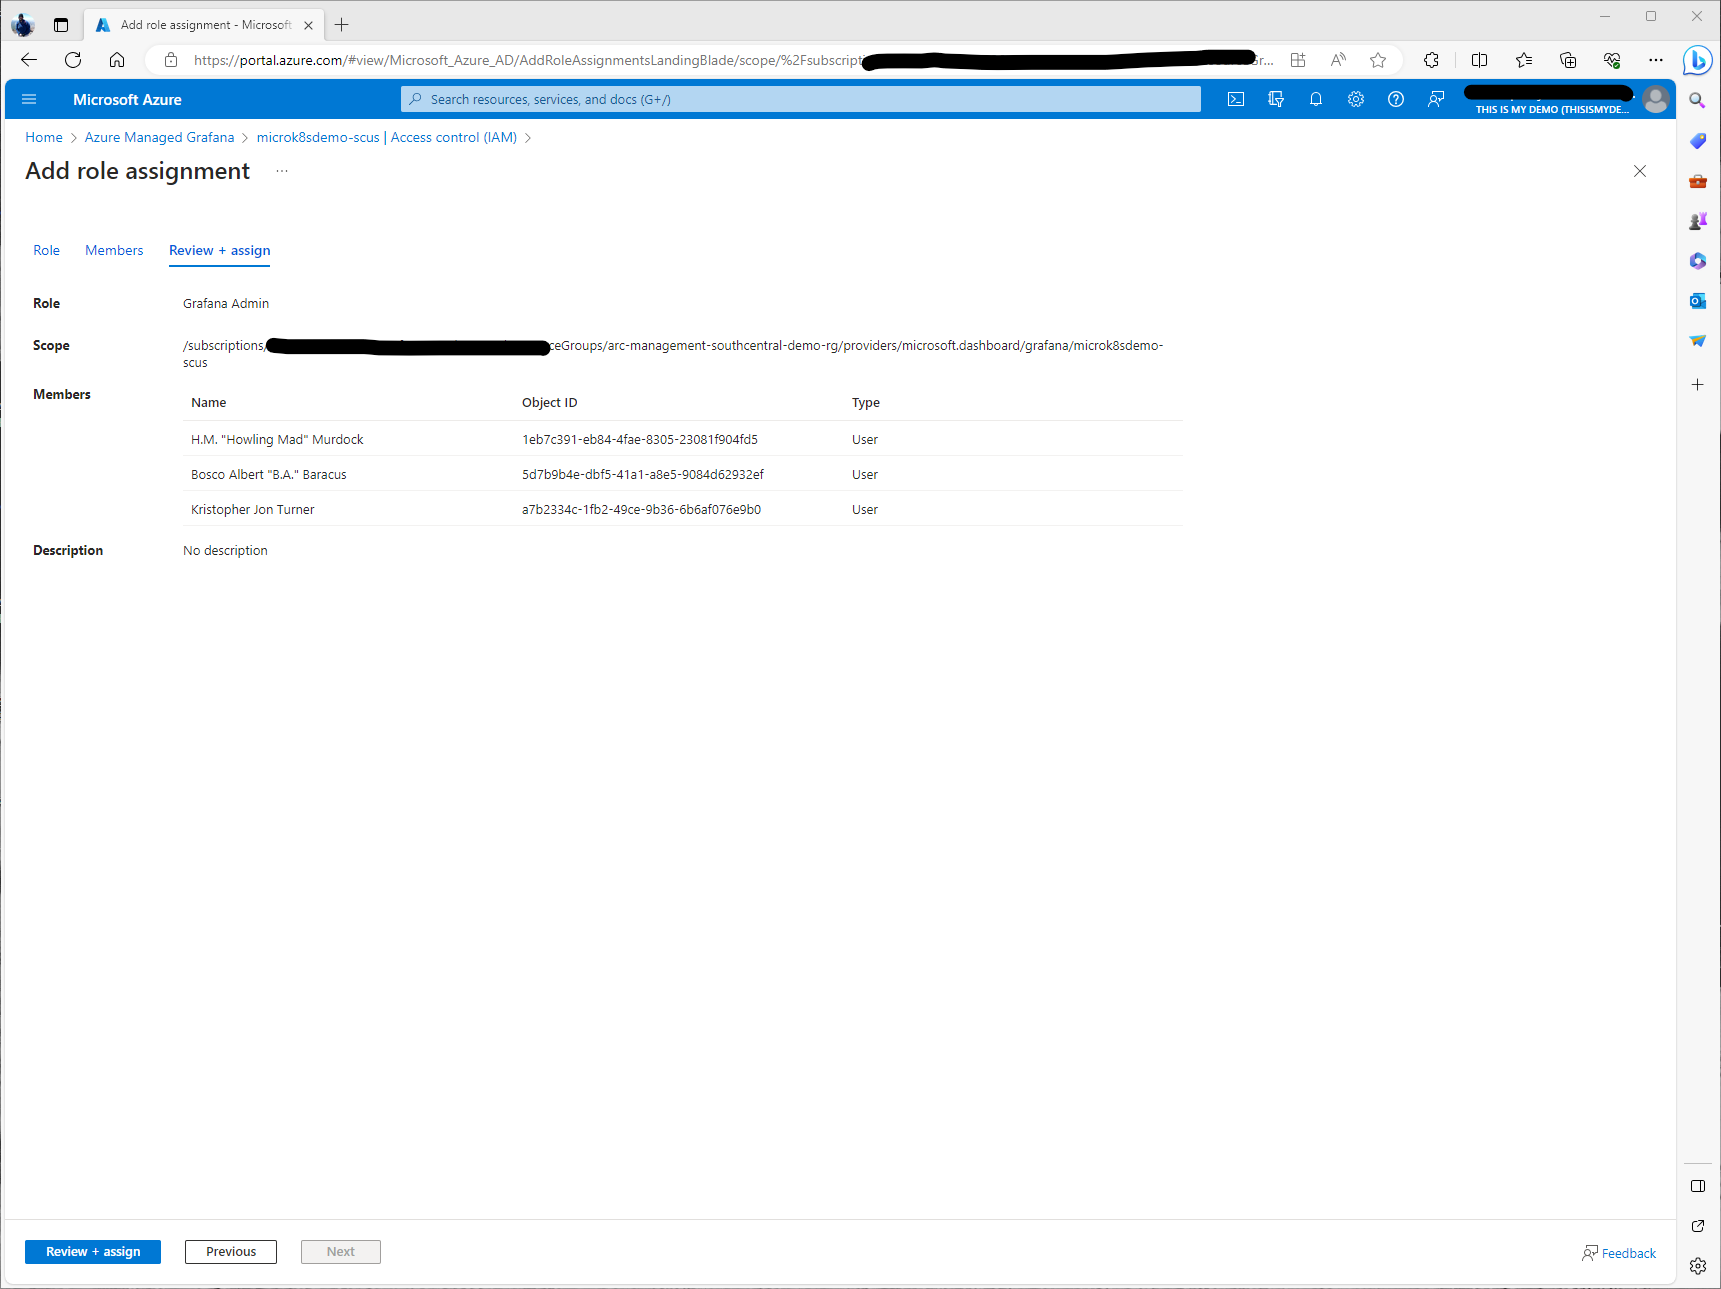
A quick confirmation that my users will be added to their new roles.
Next I logged on to the dashboard using the endpoint URL from the Overview window.
Here I can now see that my managed Grafana instance is running. As I mentioned, I am not a Grafana SME so I had to look around a bit.
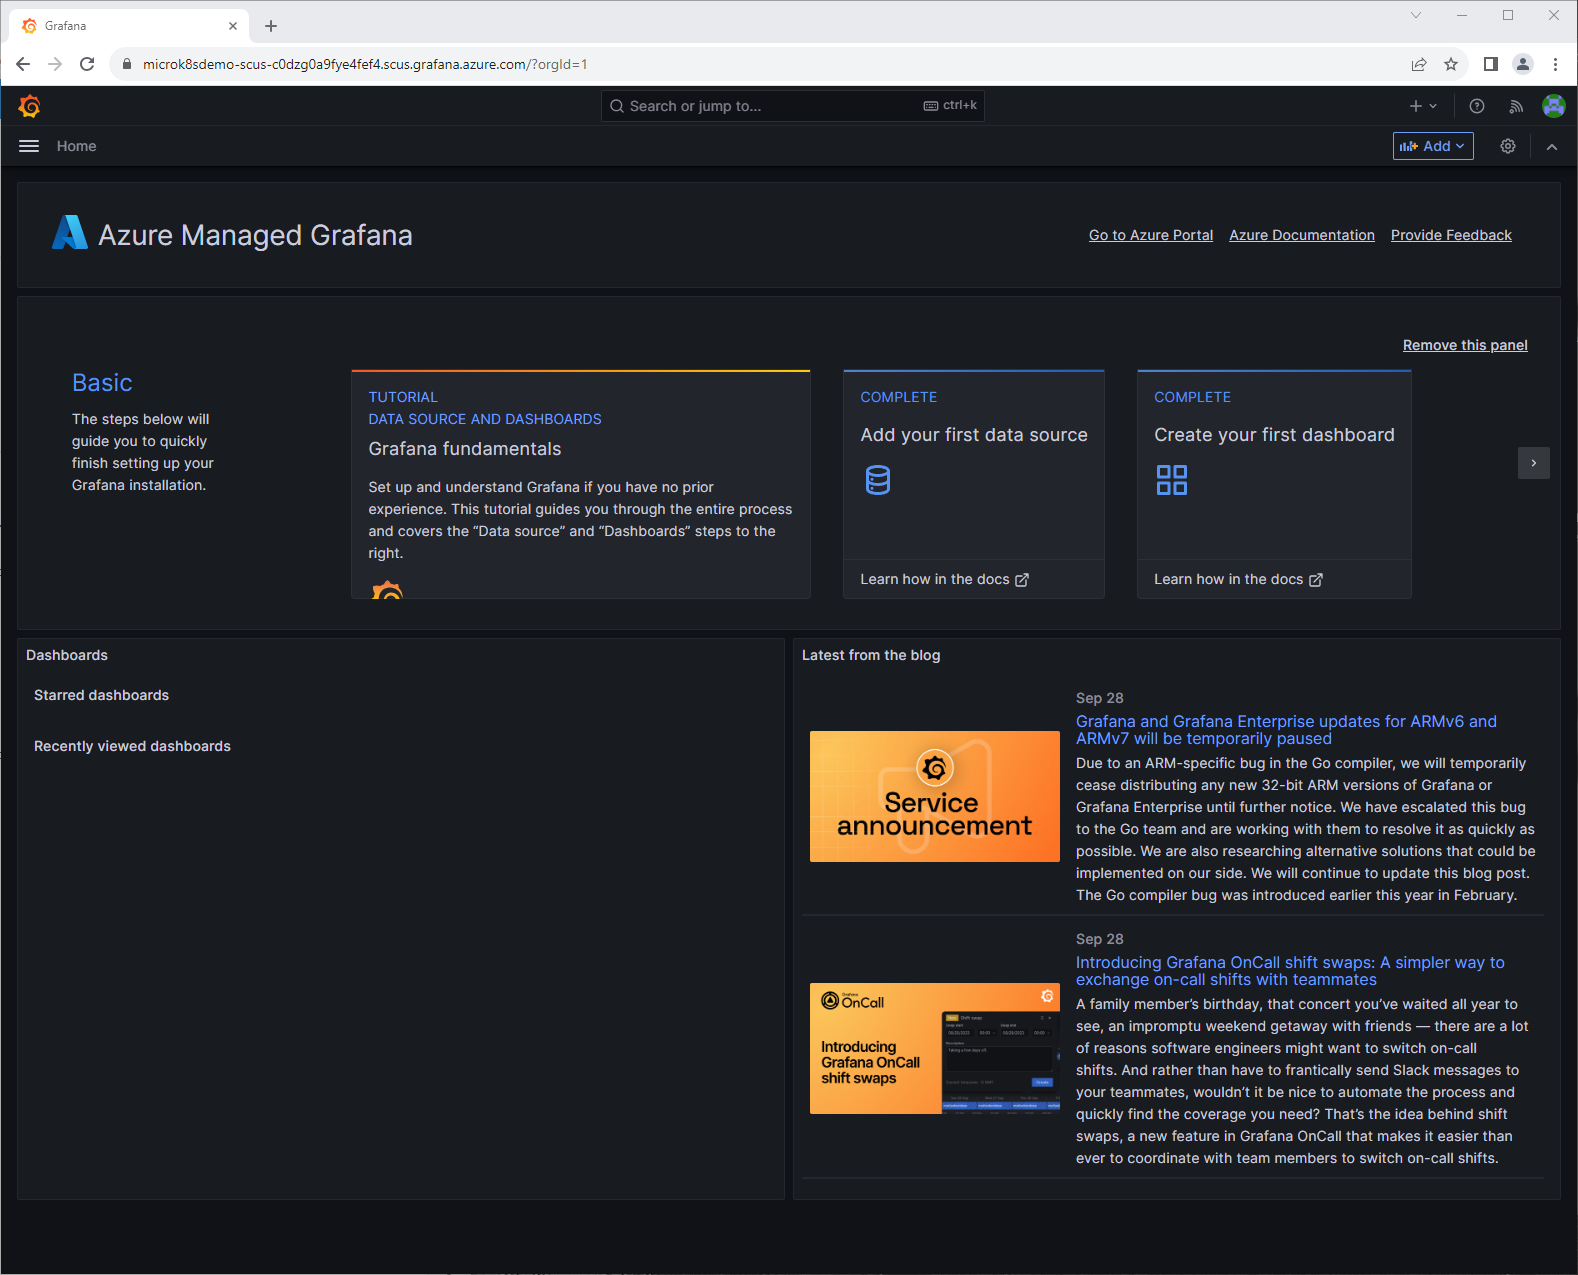
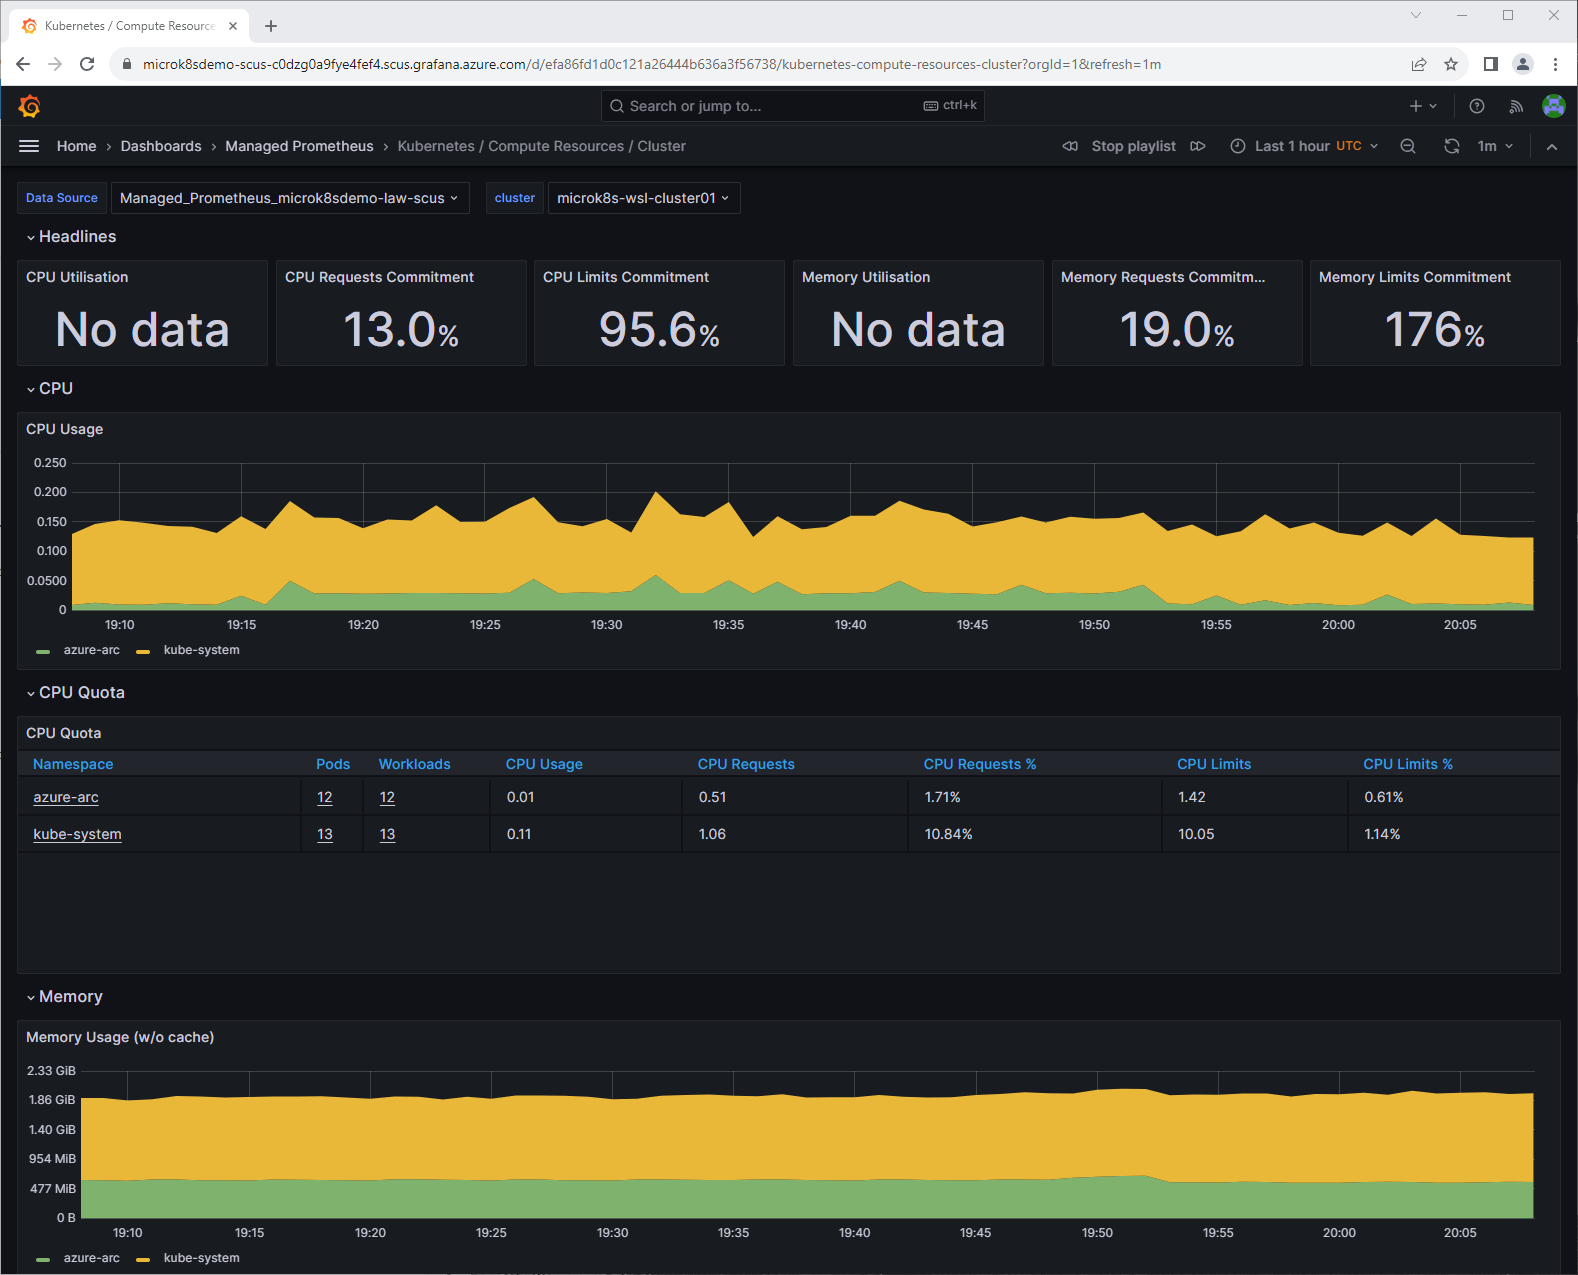
When I clicked on the Hamburger menu on the top left, I got a drop down, expanded Dashboards and saw a list of available dashboards pre-created. There were some for Azure Monitor plus some for monitoring Kubernetes. I selected one just to see what it looked like.
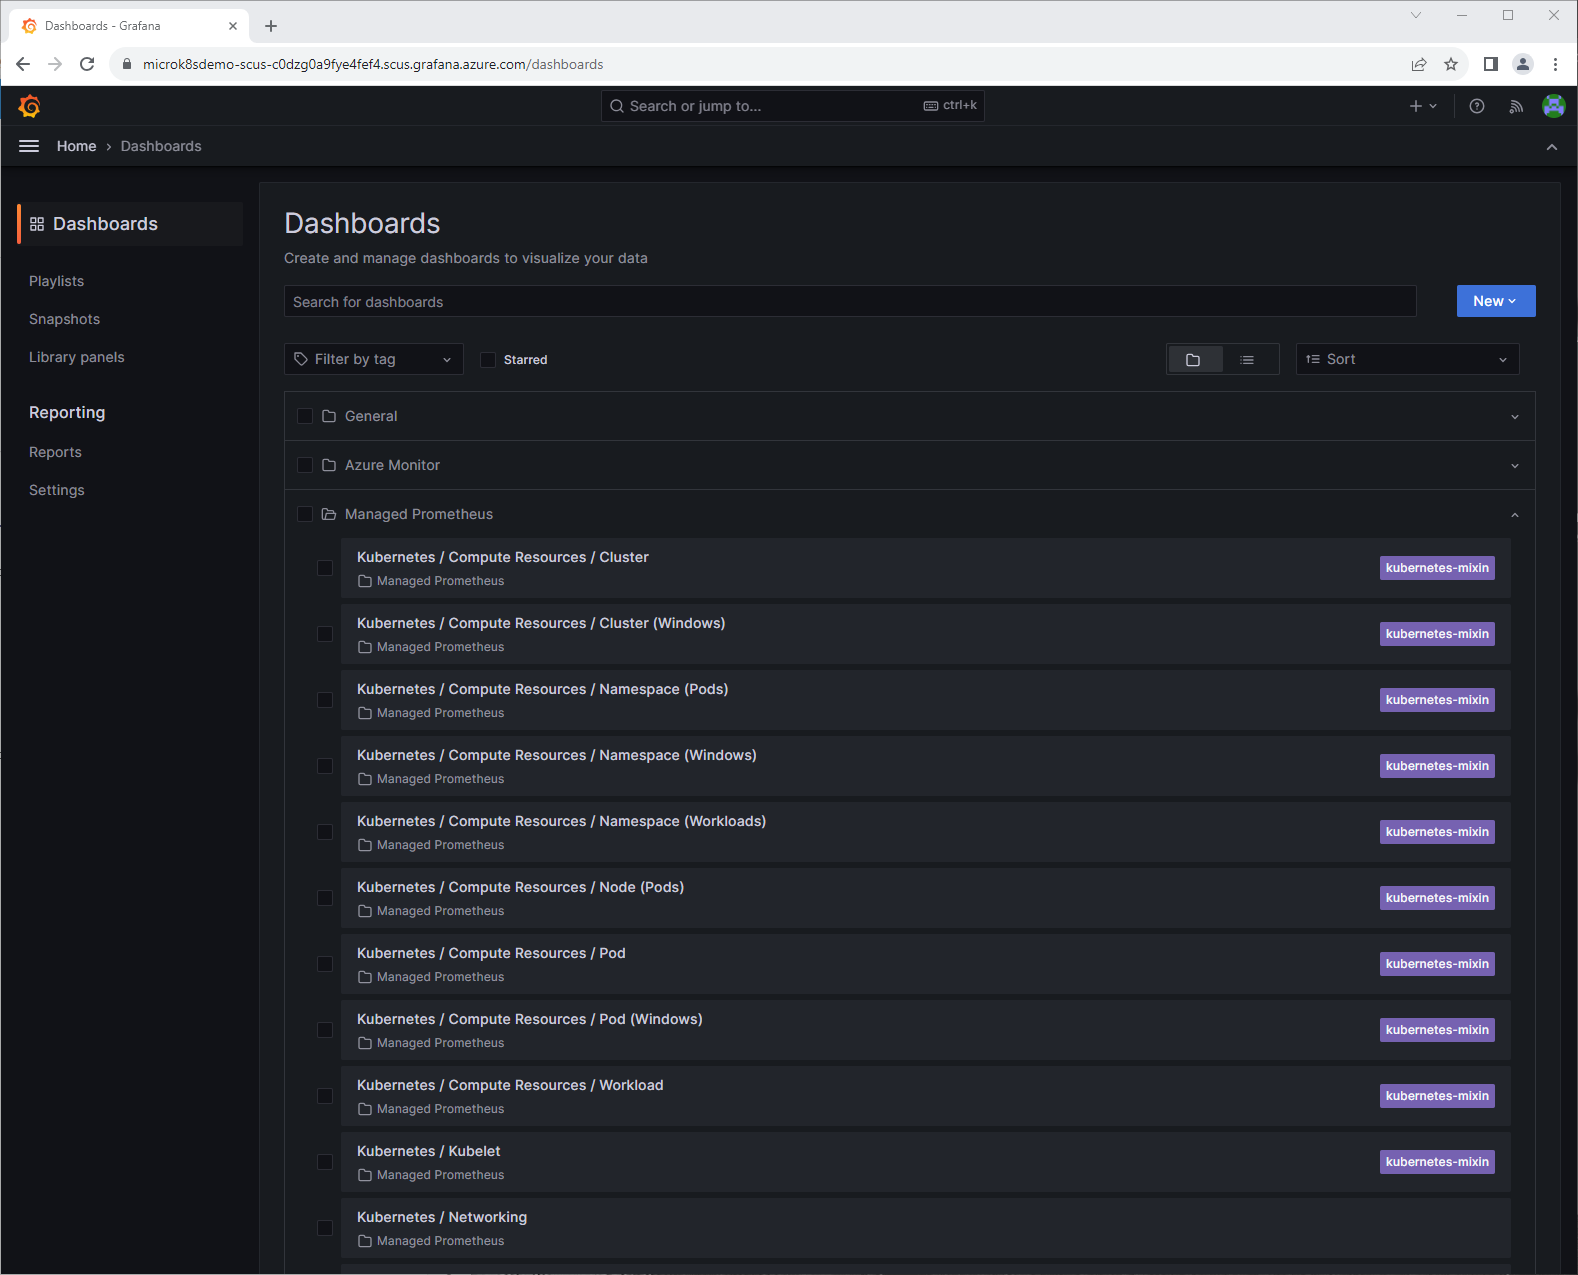
So far so good. There are a number of pre-made dashboards which can be nice for a NOC or something.
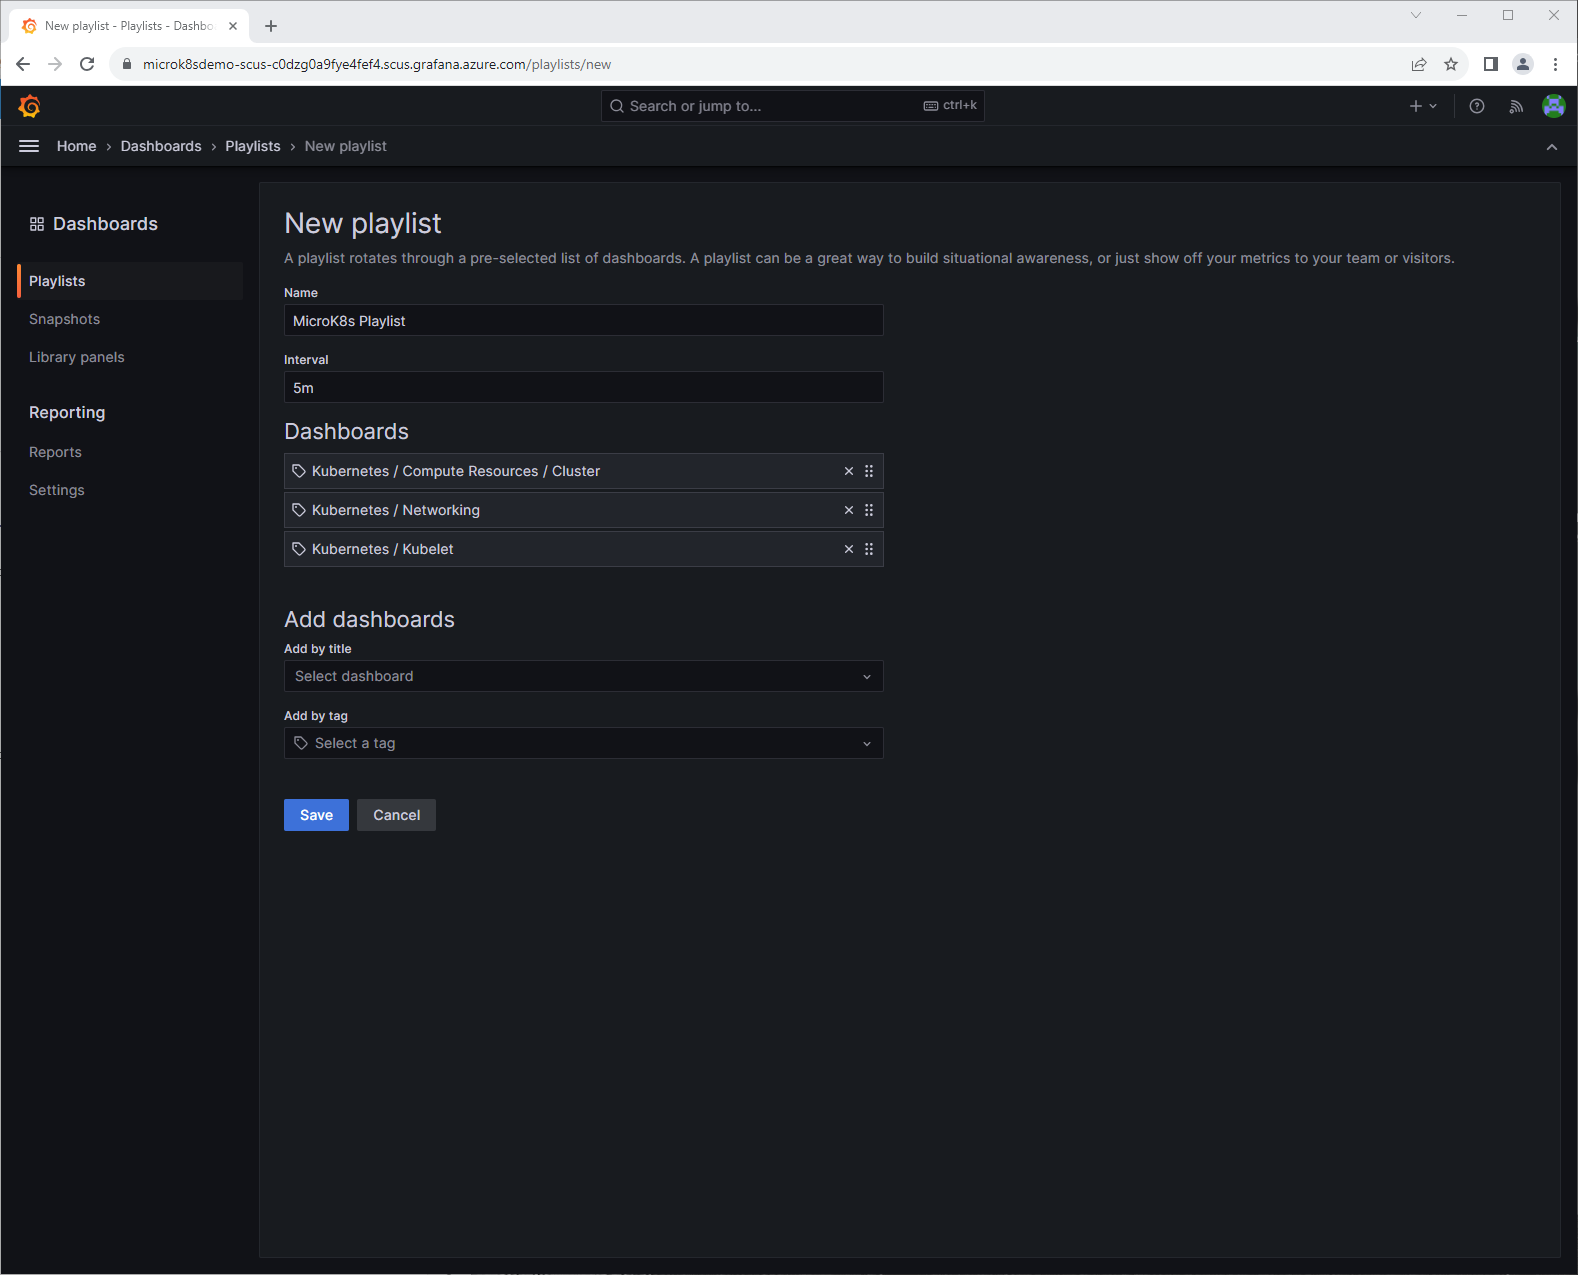
Looking around I found a way to make a playlist of the important dashboards I needed. I created one just to check it out.
We now have our MicroK8s cluster that is managed by Azure Arc-enabled Kubernetes that is running on a WSL instance managed by Azure Arc-enabled Servers running on my laptop being monitored by Azure Monitor Container Insights. Along with some pretty nice looking dashboards on Azure Managed Grafana from data collected by Azure Managed Prometheus. I went really high level on these topics in this blog. I have many more blogs coming out soon that are part of this series. The next one I will focus on Azure POlicy and how to assign those policies to my MicroK8s cluster running on WSL.